ASUS GeForce GTX 560 DC2 TOP review index
- Page 1 – ASUS GTX 560 DC2 TOP: Presentation
- Page 2 – ASUS GTX 560 DC2 TOP: Features
- Page 3 – ASUS GTX 560 DC2 TOP: OpenGL Tests
- Page 4 – ASUS GTX 560 DC2 TOP: Direct3D Tests
- Page 5 – ASUS GTX 560 DC2 TOP: Gaming Tests
- Page 6 – ASUS GTX 560 DC2 TOP: Power Consumption and Overclocking
- Page 7 – ASUS GTX 560 DC2 TOP: Conclusion
3 – ASUS GeForce GTX 560 DC2 TOP: OpenGL Tests
Testbed:
– CPU: Core i7 960 @ 3.2GHz
– RAM: 4GB DDR3 Corsair Dominator
– Motherboard: GIGABYTE X58-A UD5
– Windows 7 64-bit
– Graphics drivers: R270.48 (on ASUS CDROM)
– PSU: Corsair AX1200
3.1 FurMark (OpenGL 2)
FurMark 1.8.2 and FurMark 1.9.0 have been used for the test. FurMark homepage is HERE.
Rule: The higher the number of points, the faster the card is.
FurMark 1.8.2 scores:
Settings: 1920×1080 fullscreen, no AA, no postFX, 60sec, Xtreme mode UNCHECKED.
| 7769 points (130 FPS) – EVGA GeForce GTX 580 SC |
| 7621 points (127 FPS) – ASUS ENGTX580 |
| 6504 points (109 FPS) – ASUS ENGTX570 DirectCU II |
| 6470 points – EVGA GeForce GTX 480 |
| 6341 points (FPS: 106) – SAPPHIRE Radeon HD 6970, GPU core: 880MHz, PowerTune: +20% |
| 5841 points (97 FPS) – ASUS GeForce GTX 560 Ti DirectCU II TOP |
| 5742 points (96 FPS) – ASUS Radeon HD 6950 DC2 (GPU @ 810MHz), PowerTune: +20% |
| 5420 points – ATI Radeon HD 5870 |
| 5383 points – ASUS Radeon HD 6950, PowerTune: +20% |
| 5326 points (89 FPS) – ASUS GeForce GTX 560 DCII TOP |
| 5161 points – MSI GeForce GTX 470 |
| 4641 points (FPS: 78) – SAPPHIRE Radeon HD 6870, GPU core: 1000MHz |
| 4583 points (FPS: 76) – SAPPHIRE Radeon HD 6870, GPU core: 980MHz |
| 4484 points (FPS: 74) – ASUS EAH6870 |
| 4310 points (FPS: 72) – SAPPHIRE Radeon HD 6870 |
| 4243 points (FPS: 71) – EVGA GeForce GTX 580 SC, OCP enabled |
| 3912 points (FPS: 65) – SAPPHIRE Radeon HD 6970, GPU core: 880MHz, PowerTune: 0 |
| 3884 points – MSI N460GTX Cyclone 768D5 OC |
| 3824 points (FPS: 64) – SAPPHIRE Radeon HD 6970, GPU core: 880MHz, PowerTune: -20% |
| 2772 points – MSI R5770 Hawk |
| 1923 points (FPS: 32) – ASUS HD 6670 |
| 1425 points (FPS: 24) – ASUS GeForce GT 440 |
FurMark 1.9.0 scores:
Settings: Preset:1080 (1920×1080 fullscreen)
| 3517 points (58 FPS) – GeForce GTX 480 SLI |
| 3457 points (57 FPS) – SAPPHIRE Radeon HD 6970 CrossFire |
| 2412 points (40 FPS) – SAPPHIRE Radeon HD 6970 |
| 2367 points (39 FPS) – MSI GeForce GTX 460 SLI |
| 2145 points (35 FPS) – EVGA GeForce GTX 580 SC |
| 2062 points (34 FPS) – ASUS HD 6950 DC2 |
| 1954 points (32 FPS) – ATI Radeon HD 5870 |
| 1872 points (31 FPS) – ASUS ENGTX570 DirectCU II |
| 1769 points (29 FPS) – EVGA GeForce GTX 480 |
| 1755 points (29 FPS) – EVGA GeForce GTX 295 |
| 1696 points (28 FPS) – ASUS GTX560 Ti DirectCU II |
| 1640 points (27 FPS) – SAPPHIRE Radeon HD 6870 |
| 1527 points (25 FPS) – ASUS GeForce GTX 560 DCII TOP |
| 1468 points (24 FPS) – MSI GeForce GTX 470 |
| 740 points (12 FPS) – MSI GeForce GTX 260 |
| 674 points (11 FPS) – ASUS HD 6670 |
| 390 points (6 FPS) – ASUS GeForce GT 440 |
3.2 TessMark (OpenGL 4)
Hardware tessellation is one of the big features of Direct3D 11 and OpenGL 4 capable graphics cards. TessMark is a new benchmark focused only on the tessellation engine of DX11 class cards. It’s a pure tessellation benchmark, it does not contain complex shader or other heavy texture fetches. TessMark shows an overview of the tessellation engine raw power, that’s all. DX11 specifies that the tessellation factor can vary from 1.0 up tp 64.0. Of course, for tessellation factors like 32 or 64, most of the tessellated triangles are smaller than… a pixel. In those cases, tessellation is useless and in a real world application such as a game, high tessellation factors won’t be used. But in the case of a synthetic benchmark, it’s always instructive to see how cards can handle the whole range of tessellation level.
TessMark 0.3.0 has been used for the test.
Settings: 1920×1080 fullscreen, no AA, 60sec, map set 1.
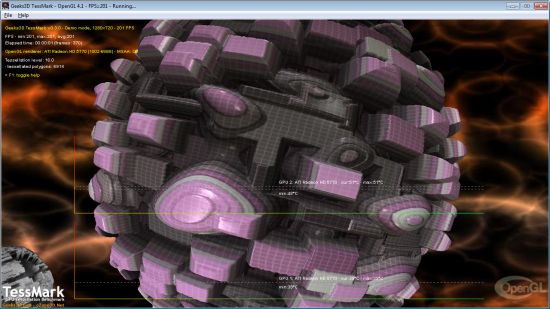
Rule: The higher the number of points, the faster the card is.
Tessellation factor 8.0: moderate
| 53151 (888FPS) – EVGA GTX 580 SC |
| 52188 (872FPS) – ASUS ENGTX580 |
| 48084 – EVGA GeForce GTX 480 |
| 47989 (802FPS) – ASUS GTX 570 DirectCU II |
| 39663 points (662 FPS) – ASUS GeForce GTX 560 Ti DirectCU II TOP |
| 38191 – MSI GeForce GTX 470 |
| 37989 points (634 FPS) – ASUS GeForce GTX 560 DCII TOP |
| 30512 – MSI N460GTX Cyclone 768D5 OC |
| 29633 points (494 FPS) – ASUS Radeon HD 6950 DC2 (GPU @ 810MHz) |
| 27718 (462FPS) – Sapphire HD 6870, GPU core: 1000MHz |
| 27469 (458FPS) – Sapphire HD 6970, GPU core: 880MHz |
| 26223 – ASUS EAH6870 |
| 25480 (425FPS) – ASUS Radeon HD 6950 |
| 24161 (403FPS) – ATI Radeon HD 5870 |
| 23131 (386FPS) – Sapphire HD 6870 |
| 20745 – MSI R5770 Hawk |
| 10148 (169 FPS) – ASUS GeForce GT 440 |
| 6583 (110FPS) – ASUS Radeon HD 6670 |
Tessellation factor 16.0: normal
| 33266 (555FPS) – EVGA GTX 580 SC |
| 32666 (545FPS) – ASUS ENGTX580 |
| 29726 (496FPS) – ASUS GTX 570 DirectCU II |
| 29196 – EVGA GeForce GTX 480 |
| 23594 points (393 FPS) – ASUS GeForce GTX 560 Ti DirectCU II TOP |
| 23316 – MSI GeForce GTX 470 |
| 22296 points (372 FPS) – ASUS GeForce GTX 560 DCII TOP |
| 17452 – MSI N460GTX Cyclone 768D5 OC |
| 9255 (154FPS) – Sapphire HD 6870, GPU core: 1000MHz |
| 8846 points (147 FPS) – ASUS Radeon HD 6950 DC2 (GPU @ 810MHz) |
| 8555 – ASUS EAH6870 |
| 8229 (137FPS) – Sapphire HD 6970, GPU core: 880MHz |
| 8177 (136FPS) – Sapphire HD 6870 |
| 8018 (134FPS) – ATI Radeon HD 5870 |
| 7669 – MSI R5770 Hawk |
| 7384 (123FPS) – ASUS HD 6950 |
| 6345 (106 FPS) – ASUS GeForce GT 440 |
| 3559 (59FPS) – ASUS Radeon HD 6670 |
Tessellation factor 32.0: extreme
| 15427 (257FPS) – EVGA GTX 580 SC |
| 15128 (252FPS) – ASUS ENGTX580 |
| 13429 (224FPS) – ASUS GTX 570 DirectCU II |
| 13008 – EVGA GeForce GTX 480 |
| 9997 – MSI GeForce GTX 470 |
| 9878 points (165 FPS) – ASUS GeForce GTX 560 Ti DirectCU II TOP |
| 8526 points (142 FPS) – ASUS GeForce GTX 560 DCII TOP |
| 6729 – MSI N460GTX Cyclone 768D5 OC |
| 2826 (47FPS) – ASUS GeForce GT 440 |
| 2299 – ASUS EAH6870 |
| 2246 (38FPS) – Sapphire HD 6870 |
| 2156 (36FPS) – ATI Radeon HD 5870 |
| 2122 (35FPS) – Sapphire HD 6970, GPU core: 880MHz |
| 2159 – MSI R5770 Hawk |
| 1988 points (33 FPS) – ASUS Radeon HD 6950 DC2 (GPU @ 810MHz) |
| 1910 (32FPS) – ASUS HD 6950 |
| 1540 (26FPS) – ASUS Radeon HD 6670 |
Tessellation factor 64.0: insane
| 4940 (82FPS) – EVGA GTX 580 SC |
| 4840 (81FPS) – ASUS ENGTX580 |
| 4179 (70FPS) – ASUS GTX 570 DirectCU II |
| 3963 – EVGA GeForce GTX 480 |
| 3169 – MSI GeForce GTX 470 |
| 2895 points (48 FPS) – ASUS GeForce GTX 560 Ti DirectCU II TOP |
| 2485 points (42 FPS) – ASUS GeForce GTX 560 DCII TOP |
| 1959 – MSI N460GTX Cyclone 768D5 OC |
| 868 (15FPS) – ASUS GeForce GT 440 |
| 585 – ASUS EAH6870 |
| 574 (10FPS) – Sapphire HD 6870 |
| 565 – MSI R5770 Hawk |
| 550 (10FPS) – ATI Radeon HD 5870 |
| 539 (9FPS) – Sapphire HD 6970, GPU core: 880MHz |
| 490 points (9 FPS) – ASUS Radeon HD 6950 DC2 (GPU @ 810MHz) |
| 485 (9FPS) – ASUS HD 6950 |
| 485 (9FPS) – ASUS Radeon HD 6670 |
3.3 ShaderToyMark (OpenGL 2)
ShaderToyMark 0.2.0 is an OpenGL 2 benchmark, developed with GeeXLab, and focused on pixel shaders only. The pixel shaders are heavily based on math (few texture fetches) and then ShaderToyMark can be seen as a kind of GPU computing benchmark.
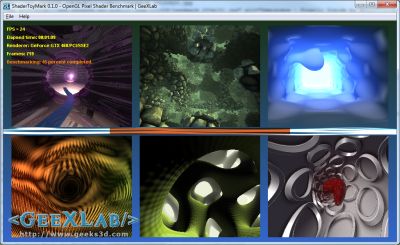
Settings: 960×540 windowed, no AA, 60sec
| 316 points (52 FPS) – EVGA GTX 580 SC |
| 306 points (51 FPS) – ASUS ENGTX580 |
| 278 points (46 FPS) – ASUS GTX 570 DirectCU II |
| 263 points (43 FPS) – GeForce GTX 480 |
| 242 points (40 FPS) – ASUS Radeon HD 6950 DC2 (GPU @ 950MHz) |
| 234 (39FPS) – Sapphire HD 6970 |
| 218 points (36 FPS) – ASUS GeForce GTX 560 Ti DirectCU II TOP |
| 208 (34FPS) – ASUS HD 6950 |
| 207 points (34 FPS) – ASUS Radeon HD 6950 DC2 (GPU @ 810MHz) |
| 202 points (33 FPS) – ASUS GeForce GTX 560 DCII TOP |
| 189 points (31 FPS) – ATI Radeon HD 5870 |
| 184 points (30 FPS) – ASUS EAH6870 |
| 179 (29FPS) – Sapphire HD 6870 |
| 156 points (26 FPS) – MSI N460GTX Cyclone |
| 104 points (17 FPS) – MSI R5770 Hawk |
| 64 points (10 FPS) – ASUS Radeon HD 6670 |
| 55 (9FPS) – ASUS GeForce GT 440 |
| 46 points (7 FPS) – GeForce 9800 GTX |
| 36 points (6 FPS) – EVGA GTX 280 |
| 33 points (5 FPS) – GeForce GTX 260 |
3.4 OpenGL 4 Mountains demo
Mountains demo is an OpenGL 4 demo that shows hierarchical-Z map based occlusion culling in action.
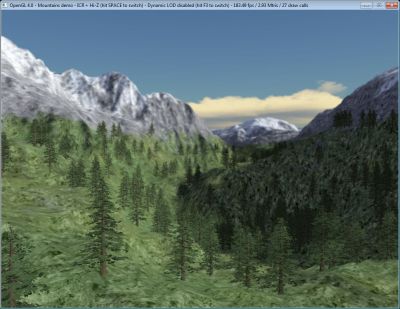
Settings: default window size: 1024×768, ICR enabled (Instance Cloud Reduction), Hi-Z enabled and dynamic LOD enabled.
| 684 FPS – EVGA GTX 580 SC |
| 674 FPS – ASUS ENGTX580 |
| 590 FPS – ASUS GTX 570 DirectCU II |
| 568 FPS – EVGA GTX 480 |
| 550 FPS – ASUS GeForce GTX 560 DCII TOP |
| 492 FPS – ASUS GeForce GTX 560 Ti DirectCU II TOP |
| 390 FPS – Sapphire Radeon HD 6970 |
| 360 FPS – ASUS Radeon HD 6950 DC2 (GPU @ 810MHz) |
| 350 FPS – MSI N460GTX Cyclone 768D5 |
| 318 FPS – ASUS Radeon HD 6950 |
| 255 FPS – ASUS EAH6870 |
| 235 FPS – Sapphire Radeon HD 6870 |
| 231 FPS – Radeon HD 5870 |
| 220 FPS – MSI R5770 Hawk |
| 192 FPS – ASUS Radeon HD 6670 |
| 122 FPS – ASUS GeForce GT 440 |
3.5 MSI Kombustor 2.x (OpenGL 4)
The branch 2.x of MSI Kombustor includes an OpenGL 4 benchmark. For this test, I used Kombustor 2.0.2. MSI Kombustor GL 4 benchmark includes a PhysX part (CPU or GPU PhysX). To make fair comparison, I ran the benchmark in CPU PhysX. More information about Kombustor 2.x can be found HERE.
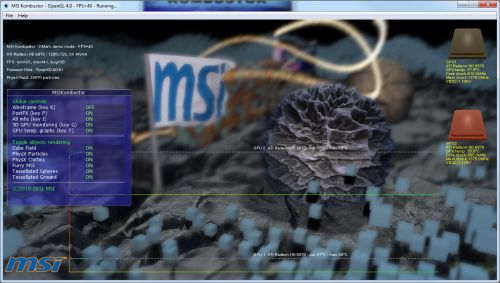
Settings: Preset:1080
| 2369 points (43 FPS) – ASUS GeForce GTX 560 DC2 TOP |
| 1902 points (36 FPS) – MSI N460GTX Cyclone 768D5 OC |
| 886 points (16 FPS) – ASUS Radeon HD 6670 |
3.6 Unigine Heaven (OpenGL 4)
For this last OpenGL test, I used Ungine Heaven 2.1, one of the standard Direct3D / OpenGL synthetic benchmark.
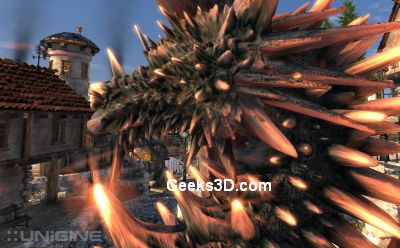
Settings: 1920×1080 fullscreen, OpenGL rendering, tessellation: normal, shaders: high, AA: 4X, 16X anisotropic filtering.
| 48.6 FPS, Scores: 1224 – EVGA GTX 580 SC |
| 46.4 FPS, Scores: 1168 – ASUS ENGTX580 |
| 40.8 FPS, Scores: 1029 – ASUS GTX 570 DirectCU II |
| 38.7 FPS, Scores: 974 – EVGA GeForce GTX 480 |
| 35.8 FPS, Scores: 901 – ASUS GeForce GTX 560 Ti DirectCU II TOP |
| 33.3 FPS, Scores: 838 – ASUS GeForce GTX 560 DC2 TOP |
| 24.7 FPS, Scores: 622 – SAPPHIRE Radeon HD 6970 |
| 24.5 FPS, Scores: 617 – MSI N460GTX Cyclone 768D5 OC |
| 24.2 FPS, Scores: 609 – ASUS Radeon HD 6950 DC2 |
| 21.6 FPS, Scores: 544 – ASUS Radeon HD 6950 |
| 15.9 FPS, Scores: 400 – ATI Radeon HD 5870 |
| 13.6 FPS, Scores: 342 – ASUS EAH6870 |
| 13.5 FPS, Scores: 339 – SAPPHIRE HD6870 |
| 9.5 FPS, Scores: 240 – ASUS GeForce GT 440 |
| 9 FPS, Scores: 227 – MSI R5770 Hawk |
| 8.9 FPS, Scores: 224 – ASUS Radeon HD 6670 |
ASUS GeForce GTX 560 DC2 TOP review index
- Page 1 – ASUS GTX 560 DC2 TOP: Presentation
- Page 2 – ASUS GTX 560 DC2 TOP: Features
- Page 3 – ASUS GTX 560 DC2 TOP: OpenGL Tests
- Page 4 – ASUS GTX 560 DC2 TOP: Direct3D Tests
- Page 5 – ASUS GTX 560 DC2 TOP: Gaming Tests
- Page 6 – ASUS GTX 560 DC2 TOP: Power Consumption and Overclocking
- Page 7 – ASUS GTX 560 DC2 TOP: Conclusion