ASUS Radeon HD 6670 review index
- Page 1 – ASUS HD 6670: Presentation
- Page 2 – ASUS HD 6670: Features
- Page 3 – ASUS HD 6670: OpenGL Tests
- Page 4 – ASUS HD 6670: Direct3D Tests
- Page 5 – ASUS HD 6670: Gaming Tests
- Page 6 – ASUS HD 6670: Power Consumption and Temperature
- Page 7 – ASUS HD 6670: Conclusion
3 – ASUS Radeon HD 6670 OpenGL Tests
Testbed:
– CPU: Core i7 960 @ 3.2GHz
– RAM: 4GB DDR3 Corsair Dominator
– Motherboard: GIGABYTE X58-A UD5
– Windows 7 64-bit
– Graphics drivers: Catalyst 11.5 hotfix
– PSU: Corsair AX1200
3.1 FurMark (OpenGL 2)
FurMark 1.8.2 and FurMark 1.9.0 have been used for the test. FurMark homepage is HERE.
Rule: The higher the number of points, the faster the card is.
FurMark 1.8.2 scores:
Settings: 1920×1080 fullscreen, no AA, no postFX, 60sec, Xtreme mode UNCHECKED.
| 7769 points (130 FPS) – EVGA GeForce GTX 580 SC |
| 7621 points (127 FPS) – ASUS ENGTX580 |
| 6504 points (109 FPS) – ASUS ENGTX570 DirectCU II |
| 6470 points – EVGA GeForce GTX 480 |
| 6341 points (FPS: 106) – SAPPHIRE Radeon HD 6970, GPU core: 880MHz, PowerTune: +20% |
| 5841 points (97 FPS) – ASUS GeForce GTX 560 Ti DirectCU II TOP |
| 5742 points (96 FPS) – ASUS Radeon HD 6950 DC2 (GPU @ 810MHz), PowerTune: +20% |
| 5420 points – ATI Radeon HD 5870 |
| 5383 points – ASUS Radeon HD 6950, PowerTune: +20% |
| 5161 points – MSI GeForce GTX 470 |
| 4641 points (FPS: 78) – SAPPHIRE Radeon HD 6870, GPU core: 1000MHz |
| 4583 points (FPS: 76) – SAPPHIRE Radeon HD 6870, GPU core: 980MHz |
| 4484 points (FPS: 74) – ASUS EAH6870 |
| 4310 points (FPS: 72) – SAPPHIRE Radeon HD 6870 |
| 4243 points (FPS: 71) – EVGA GeForce GTX 580 SC, OCP enabled |
| 3912 points (FPS: 65) – SAPPHIRE Radeon HD 6970, GPU core: 880MHz, PowerTune: 0 |
| 3884 points – MSI N460GTX Cyclone 768D5 OC |
| 3824 points (FPS: 64) – SAPPHIRE Radeon HD 6970, GPU core: 880MHz, PowerTune: -20% |
| 2772 points – MSI R5770 Hawk |
| 1923 points (FPS: 32) – ASUS HD 6670 |
| 1425 points (FPS: 24) – ASUS GeForce GT 440 |
FurMark 1.9.0 scores:
Settings: Preset:1080 (1920×1080 fullscreen)
| 3517 points (58 FPS) – GeForce GTX 480 SLI |
| 3457 points (57 FPS) – SAPPHIRE Radeon HD 6970 CrossFire |
| 2412 points (40 FPS) – SAPPHIRE Radeon HD 6970 |
| 2367 points (39 FPS) – MSI GeForce GTX 460 SLI |
| 2145 points (35 FPS) – EVGA GeForce GTX 580 SC |
| 2062 points (34 FPS) – ASUS HD 6950 DC2 |
| 1954 points (32 FPS) – ATI Radeon HD 5870 |
| 1872 points (31 FPS) – ASUS ENGTX570 DirectCU II |
| 1769 points (29 FPS) – EVGA GeForce GTX 480 |
| 1755 points (29 FPS) – EVGA GeForce GTX 295 |
| 1696 points (28 FPS) – ASUS GTX560 Ti DirectCU II |
| 1640 points (27 FPS) – SAPPHIRE Radeon HD 6870 |
| 1468 points (24 FPS) – MSI GeForce GTX 470 |
| 740 points (12 FPS) – MSI GeForce GTX 260 |
| 674 points (11 FPS) – ASUS HD 6670 |
| 390 points (6 FPS) – ASUS GeForce GT 440 |
3.2 TessMark (OpenGL 4)
Hardware tessellation is one of the big features of Direct3D 11 and OpenGL 4 capable graphics cards. TessMark is a new benchmark focused only on the tessellation engine of DX11 class cards. It’s a pure tessellation benchmark, it does not contain complex shader or other heavy texture fetches. TessMark shows an overview of the tessellation engine raw power, that’s all. DX11 specifies that the tessellation factor can vary from 1.0 up tp 64.0. Of course, for tessellation factors like 32 or 64, most of the tessellated triangles are smaller than… a pixel. In those cases, tessellation is useless and in a real world application such as a game, high tessellation factors won’t be used. But in the case of a synthetic benchmark, it’s always instructive to see how cards can handle the whole range of tessellation level.
TessMark 0.3.0 has been used for the test.
Settings: 1920×1080 fullscreen, no AA, 60sec, map set 1.
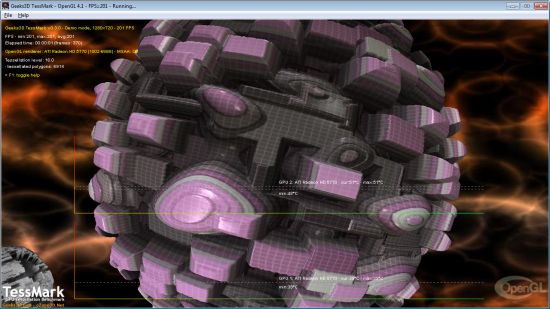
Rule: The higher the number of points, the faster the card is.
Tessellation factor 8.0: moderate
| 53151 (888FPS) – EVGA GTX 580 SC |
| 52188 (872FPS) – ASUS ENGTX580 |
| 48084 – EVGA GeForce GTX 480 |
| 47989 (802FPS) – ASUS GTX 570 DirectCU II |
| 39663 points (662 FPS) – ASUS GeForce GTX 560 Ti DirectCU II TOP |
| 38191 – MSI GeForce GTX 470 |
| 30512 – MSI N460GTX Cyclone 768D5 OC |
| 29633 points (494 FPS) – ASUS Radeon HD 6950 DC2 (GPU @ 810MHz) |
| 27718 (462FPS) – Sapphire HD 6870, GPU core: 1000MHz |
| 27469 (458FPS) – Sapphire HD 6970, GPU core: 880MHz |
| 26223 – ASUS EAH6870 |
| 25480 (425FPS) – ASUS Radeon HD 6950 |
| 24161 (403FPS) – ATI Radeon HD 5870 |
| 23131 (386FPS) – Sapphire HD 6870 |
| 20745 – MSI R5770 Hawk |
| 10148 (169 FPS) – ASUS GeForce GT 440 |
| 6583 (110FPS) – ASUS Radeon HD 6670 |
Tessellation factor 16.0: normal
| 33266 (555FPS) – EVGA GTX 580 SC |
| 32666 (545FPS) – ASUS ENGTX580 |
| 29726 (496FPS) – ASUS GTX 570 DirectCU II |
| 29196 – EVGA GeForce GTX 480 |
| 23594 points (393 FPS) – ASUS GeForce GTX 560 Ti DirectCU II TOP |
| 23316 – MSI GeForce GTX 470 |
| 17452 – MSI N460GTX Cyclone 768D5 OC |
| 9255 (154FPS) – Sapphire HD 6870, GPU core: 1000MHz |
| 8846 points (147 FPS) – ASUS Radeon HD 6950 DC2 (GPU @ 810MHz) |
| 8555 – ASUS EAH6870 |
| 8229 (137FPS) – Sapphire HD 6970, GPU core: 880MHz |
| 8177 (136FPS) – Sapphire HD 6870 |
| 8018 (134FPS) – ATI Radeon HD 5870 |
| 7669 – MSI R5770 Hawk |
| 7384 (123FPS) – ASUS HD 6950 |
| 6345 (106 FPS) – ASUS GeForce GT 440 |
| 3559 (59FPS) – ASUS Radeon HD 6670 |
Tessellation factor 32.0: extreme
| 15427 (257FPS) – EVGA GTX 580 SC |
| 15128 (252FPS) – ASUS ENGTX580 |
| 13429 (224FPS) – ASUS GTX 570 DirectCU II |
| 13008 – EVGA GeForce GTX 480 |
| 9997 – MSI GeForce GTX 470 |
| 9878 points (165 FPS) – ASUS GeForce GTX 560 Ti DirectCU II TOP |
| 6729 – MSI N460GTX Cyclone 768D5 OC |
| 2826 (47FPS) – ASUS GeForce GT 440 |
| 2299 – ASUS EAH6870 |
| 2246 (38FPS) – Sapphire HD 6870 |
| 2156 (36FPS) – ATI Radeon HD 5870 |
| 2122 (35FPS) – Sapphire HD 6970, GPU core: 880MHz |
| 2159 – MSI R5770 Hawk |
| 1988 points (33 FPS) – ASUS Radeon HD 6950 DC2 (GPU @ 810MHz) |
| 1910 (32FPS) – ASUS HD 6950 |
| 1540 (26FPS) – ASUS Radeon HD 6670 |
Tessellation factor 64.0: insane
| 4940 (82FPS) – EVGA GTX 580 SC |
| 4840 (81FPS) – ASUS ENGTX580 |
| 4179 (70FPS) – ASUS GTX 570 DirectCU II |
| 3963 – EVGA GeForce GTX 480 |
| 3169 – MSI GeForce GTX 470 |
| 2895 points (48 FPS) – ASUS GeForce GTX 560 Ti DirectCU II TOP |
| 1959 – MSI N460GTX Cyclone 768D5 OC |
| 868 (15FPS) – ASUS GeForce GT 440 |
| 585 – ASUS EAH6870 |
| 574 (10FPS) – Sapphire HD 6870 |
| 565 – MSI R5770 Hawk |
| 550 (10FPS) – ATI Radeon HD 5870 |
| 539 (9FPS) – Sapphire HD 6970, GPU core: 880MHz |
| 490 points (9 FPS) – ASUS Radeon HD 6950 DC2 (GPU @ 810MHz) |
| 485 (9FPS) – ASUS HD 6950 |
| 485 (9FPS) – ASUS Radeon HD 6670 |
3.3 ShaderToyMark (OpenGL 2)
ShaderToyMark 0.2.0 is an OpenGL 2 benchmark, developed with GeeXLab, and focused on pixel shaders only. The pixel shaders are heavily based on math (few texture fetches) and then ShaderToyMark can be seen as a kind of GPU computing benchmark.
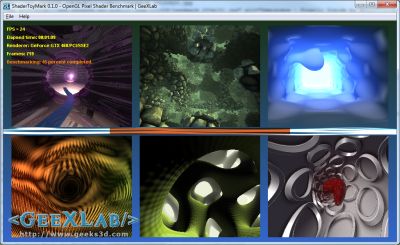
Settings: 960×540 windowed, no AA, 60sec
| 316 points (52 FPS) – EVGA GTX 580 SC |
| 306 points (51 FPS) – ASUS ENGTX580 |
| 278 points (46 FPS) – ASUS GTX 570 DirectCU II |
| 263 points (43 FPS) – GeForce GTX 480 |
| 242 points (40 FPS) – ASUS Radeon HD 6950 DC2 (GPU @ 950MHz) |
| 234 (39FPS) – Sapphire HD 6970 |
| 218 points (36 FPS) – ASUS GeForce GTX 560 Ti DirectCU II TOP |
| 208 (34FPS) – ASUS HD 6950 |
| 207 points (34 FPS) – ASUS Radeon HD 6950 DC2 (GPU @ 810MHz) |
| 189 points (31 FPS) – ATI Radeon HD 5870 |
| 184 points (30 FPS) – ASUS EAH6870 |
| 179 (29FPS) – Sapphire HD 6870 |
| 156 points (26 FPS) – MSI N460GTX Cyclone |
| 104 points (17 FPS) – MSI R5770 Hawk |
| 64 points (10 FPS) – ASUS Radeon HD 6670 |
| 55 (9FPS) – ASUS GeForce GT 440 |
| 46 points (7 FPS) – GeForce 9800 GTX |
| 36 points (6 FPS) – EVGA GTX 280 |
| 33 points (5 FPS) – GeForce GTX 260 |
3.4 OpenGL 4 Mountains demo
Mountains demo is an OpenGL 4 demo that shows hierarchical-Z map based occlusion culling in action.
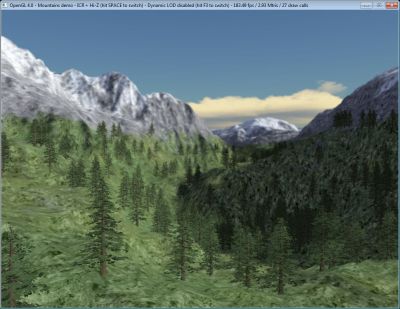
Settings: default window size: 1024×768, ICR enabled (Instance Cloud Reduction), Hi-Z enabled and dynamic LOD enabled.
| 684 FPS – EVGA GTX 580 SC |
| 674 FPS – ASUS ENGTX580 |
| 590 FPS – ASUS GTX 570 DirectCU II |
| 568 FPS – EVGA GTX 480 |
| 492 FPS – ASUS GeForce GTX 560 Ti DirectCU II TOP |
| 390 FPS – Sapphire Radeon HD 6970 |
| 360 FPS – ASUS Radeon HD 6950 DC2 (GPU @ 810MHz) |
| 350 FPS – MSI N460GTX Cyclone 768D5 |
| 318 FPS – ASUS Radeon HD 6950 |
| 255 FPS – ASUS EAH6870 |
| 235 FPS – Sapphire Radeon HD 6870 |
| 231 FPS – Radeon HD 5870 |
| 220 FPS – MSI R5770 Hawk |
| 192 FPS – ASUS Radeon HD 6670 |
| 122 FPS – ASUS GeForce GT 440 |
3.5 MSI Kombustor 2.x (OpenGL 4)
The branch 2.x of MSI Kombustor includes an OpenGL 4 benchmark. For this test, I used Kombustor 2.0.2. MSI Kombustor GL 4 benchmark includes a PhysX part (CPU or GPU PhysX). To make fair comparison, I ran the benchmark in CPU PhysX. More information about Kombustor 2.x can be found HERE.
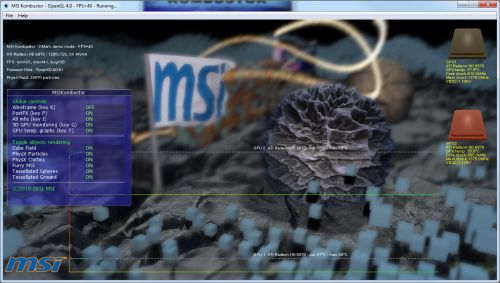
Settings: Preset:1080
| 1902 points (36 FPS) – MSI N460GTX Cyclone 768D5 OC |
| 886 points (16 FPS) – ASUS Radeon HD 6670 |
3.6 Unigine Heaven (OpenGL 4)
For this last OpenGL test, I used Ungine Heaven 2.1, one of the standard Direct3D / OpenGL synthetic benchmark.
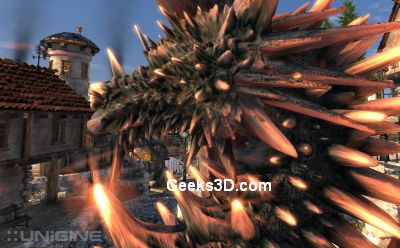
Settings: 1920×1080 fullscreen, OpenGL rendering, tessellation: normal, shaders: high, AA: 4X, 16X anisotropic filtering.
| 48.6 FPS, Scores: 1224 – EVGA GTX 580 SC |
| 46.4 FPS, Scores: 1168 – ASUS ENGTX580 |
| 40.8 FPS, Scores: 1029 – ASUS GTX 570 DirectCU II |
| 38.7 FPS, Scores: 974 – EVGA GeForce GTX 480 |
| 35.8 FPS, Scores: 901 – ASUS GeForce GTX 560 Ti DirectCU II TOP |
| 24.7 FPS, Scores: 622 – SAPPHIRE Radeon HD 6970 |
| 24.5 FPS, Scores: 617 – MSI N460GTX Cyclone 768D5 OC |
| 24.2 FPS, Scores: 609 – ASUS Radeon HD 6950 DC2 |
| 21.6 FPS, Scores: 544 – ASUS Radeon HD 6950 |
| 15.9 FPS, Scores: 400 – ATI Radeon HD 5870 |
| 13.6 FPS, Scores: 342 – ASUS EAH6870 |
| 13.5 FPS, Scores: 339 – SAPPHIRE HD6870 |
| 9.5 FPS, Scores: 240 – ASUS GeForce GT 440 |
| 9 FPS, Scores: 227 – MSI R5770 Hawk |
| 8.9 FPS, Scores: 224 – ASUS Radeon HD 6670 |
ASUS Radeon HD 6670 review index
Great review. Thanks.
This Full HD is a bit funny res, i will better wait for 16:10 LCD / 1920×1200 and prices to comedown.
You say it competes with the GT440 (~75$) and GTS450 (>110$) and costs 100$. Still you only list the GT440 in the benchmarks (which obviously is slower).
To me the numbers give the impression that a GTS450 is the better decision.
@jK: you’re right, according to other tests over the Net, the GTS is a very nice alternative to the HD 6670. But I didn’t talk about the GTS 450 for two reasons: I don’t have a GTS 450 so I can’t compare performances, and the GTS 450 requires an additional power connector. Both GT 440 and HD 6670 do not have power connectors.
Yes and they both have about 12k in 3Dmark06 overall performance and they both have prices bellow 100$, so you won’t be running Physx on full HD so Radeon would be better choice here.
GTS 450 – 1Gb DDR3 99.90€
GT 440 – 1GB DDR5 (slow card) 99.90€
HD 6670 – 1GB DDR5 (fast card) 99.90€
Now who winns?
^^ HD 6670 ^^ ABS THE BIG WINNER
I feel that the power draw conclusion is a bit off.
Idle, total power cons. 92W.
FurMark, total power cons. 194W
(194 – 92) * 0.9 = 92W
That would mean that the CPU and the rest of the system does not use any more power when the GPU is stress tested. I think the 66W TDP is pretty accurate, as the manufacturers have no need to understate those figures. Also, I doubt that the PSU has 90% efficiency at sub 200W.
@Sturla:
Yes, you are correct about the efficiency number. It’s around 0.85 ~ 0.88 at that low wattage. Doing the calculations again, it results that the Radeon 6670 is about 87 ~ 89 watts in full load. Wich isn’t that far off from 92.
But there is one thing you are wrong. Furmark stresses ONLY the GPU. You have normal 1~5% cpu usage while running Furmark so you can’t blame the system using more power during stress test. And even if there were some light usage of CPU, power draw would still be in the range of 80W, somewhat over the limit of what a PCi-Ex can handle. The only con I see to this is that you can’t overclock the card. Other than that, the numbers are perfectly fine 🙂
The review doesn’t speak about CrossfireX potential. I have an A10 based machine and want to know how this will perform in Crossfire. My understanding is that you have to master off the A10, but that you can get theoretical boosts equal to some percentage of this cards performance in cross fire mode, making the machine quite capable for low power and cost. Any attempt to evaluate Crossfire or expectations?