ASUS Radeon HD 6670 review index
- Page 1 – ASUS HD 6670: Presentation
- Page 2 – ASUS HD 6670: Features
- Page 3 – ASUS HD 6670: OpenGL Tests
- Page 4 – ASUS HD 6670: Direct3D Tests
- Page 5 – ASUS HD 6670: Gaming Tests
- Page 6 – ASUS HD 6670: Power Consumption and Temperature
- Page 7 – ASUS HD 6670: Conclusion
5 – ASUS Radeon HD 6670 Gaming Tests
Synthetic benchmark are cool (from a developer point of view) but many readers are not developers and then wish to see benchmarks based on real video games. I mainly used benchmarks included in game demos and then, dear readers, if you know other game demos that include a benchmark, just let me know.
5.1 Crysis (DirectX 10)
I used the integrated GPU benchmark (64-bit) option provided with Crysis demo.
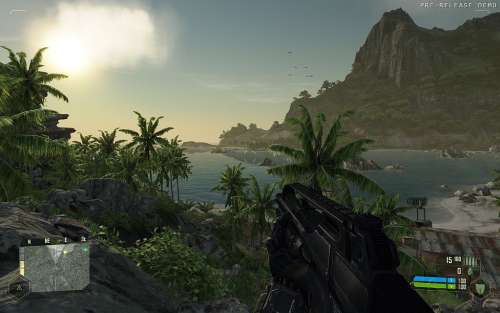
Settings: default resolution (1920×1080 fullscreen)
Results: Average FPS for the TimeDemo Run 0.
| 77.87 FPS – ASUS HD 6950 |
| 76.19 FPS – ASUS HD 6950 DC2 |
| 74.46 FPS – Sapphire HD 6970 |
| 73.60 FPS – Sapphire HD 6870 |
| 73.55 FPS – Radeon HD 5870 |
| 71.00 FPS – ASUS GTX 570 DirectCU II |
| 69.37 FPS – EVGA GeForce GTX 580 SC |
| 69.34 FPS – GeForce GTX 480 |
| 67.95 FPS – ASUS GeForce GTX 560 Ti DirectCU II TOP |
| 65.20 FPS – MSI N460GTX Cyclone |
| 49.76 FPS – ASUS Radeon HD 6670 |
| 35.02 FPS – ASUS GeForce GT 440 |
5.2 DiRT 2 (DirectX 11)
I used the benchmarking option provided with DiRT2 demo.
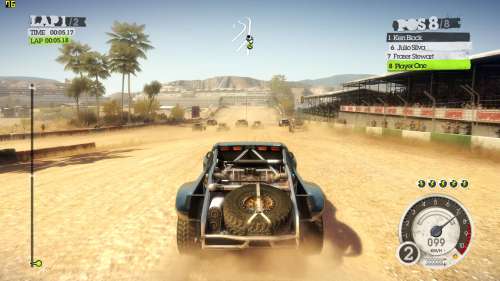
Settings: 1920×1080, 4X MSAA.
| 151.4 FPS – EVGA GeForce GTX 580 SC |
| 129.91 FPS – ASUS GTX 570 DirectCU II |
| 123.44 FPS – ASUS GeForce GTX 560 Ti DirectCU II TOP |
| 121.6 FPS – GeForce GTX 480 |
| 94.26 FPS – Sapphire HD 6970 |
| 88.74 FPS – MSI N460GTX Cyclone |
| 88.14 FPS – Radeon HD 5870 |
| 85.54 FPS – Sapphire HD 6870 |
| 85.33 FPS – ASUS HD 6950 DC2 |
| 85.09 FPS – ASUS HD 6950 |
| 41.84 FPS – ASUS Radeon HD 6670 |
| 32.90 FPS – ASUS GeForce GT 440 |
5.3 Resident Evil 5 (DirectX 10)
I used the benchmarking option (DX10 version) provided with Resident Evil 5 demo.

Settings: 1920×1080. 4XMSAA
| 120.5 FPS – ASUS GTX 570 DirectCU II |
| 118.0 FPS – EVGA GeForce GTX 580 SC |
| 116.6 FPS – GeForce GTX 480 |
| 116.0 FPS – ASUS GeForce GTX 560 Ti DirectCU II TOP |
| 115.6 FPS – Sapphire HD 6970 |
| 107.8 FPS – ASUS HD 6950 |
| 107.6 FPS – ASUS HD 6950 DirectCU II |
| 104.5 FPS – Radeon HD 5870 |
| 99.9 FPS – Sapphire HD 6870 |
| 86.4 FPS – MSI N460GTX Cyclone |
| 49.6 FPS – ASUS Radeon HD 6670 |
| 37.4 FPS – ASUS GeForce GT 440 |
Remark: the GTX 570 ahead of the GTX 580? Certainly an optimization in the recent drivers R266.58 (if so, I have to re-test the GTX 580) or a wrong reading of the score…
5.4 Aliens vs Predator (AvP) Benchmark (DirectX 11)
Aliens vs Predator or AvP is a Direct3D 11 benchmark with a touch of tessellation. See here for more details:
AvP DX11 Tessellation Battle: GTX 480 vs GTX 470 vs HD 5870 vs HD 5770.
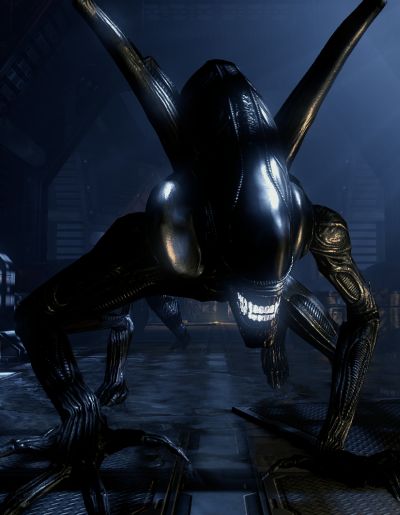
Settings: Resolution: 1920 x 1080, Texture Quality: 2, Shadow Quality: 3, Anisotropic Filtering: 16, SSAO: ON, Vertical Sync: OFF
DX11 Tessellation: ON, DX11 Advanced Shadows: ON, DX11 MSAA Samples: 1.
| 71.6 FPS – EVGA GeForce GTX 580 SC |
| 64.3 FPS – Sapphire HD 6970 |
| 61.4 FPS – ASUS GTX 570 DirectCU II |
| 58.3 FPS – GeForce GTX 480 |
| 58.2 FPS – Radeon HD 5870 |
| 56.8 FPS – ASUS HD 6950 |
| 56.6 FPS – ASUS HD 6950 DirectCU II |
| 53.9 FPS – ASUS GeForce GTX 560 Ti DirectCU II TOP |
| 47.4 FPS – Sapphire HD 6870 |
| 37 FPS – MSI N460GTX Cyclone |
| 20.1 FPS – ASUS Radeon HD 6670 |
| 14.7 FPS – ASUS GeForce GT 440 |
5.5 Lost Planet 2 (DirectX 11)
Lost Planet 2 has been used for the test.

Settings: 1920×1080 fullscreen, test A.
| 79.9 FPS – ASUS ENGTX580 |
| 75.7 FPS – EVGA GeForce GTX 580 SC |
| 70.4 FPS – ASUS GTX 570 DirectCU II |
| 60.2 FPS – EVGA GeForce GTX 480 |
| 55.36 FPS – ASUS GeForce GTX 560 Ti DirectCU II TOP |
| 48.8 FPS – MSI GeForce GTX 470 |
| 47.8 FPS – Sapphire Radeon HD 6970 |
| 46.9 FPS – ASUS Radeon HD 6950 DirectCU II |
| 44.7 FPS – ASUS Radeon HD 6950 |
| 42.3 FPS – Sapphire Radeon HD 6870 |
| 39 FPS – ASUS EAH6870 |
| 38 FPS – MSI N460GTX Cyclone 768D5 OC |
| 37.3 FPS – ATI Radeon HD 5870 |
| 23 FPS – MSI R5770 Hawk |
| 15.3 FPS – ASUS Radeon HD 6670 |
| 15.0 FPS – ASUS GeForce GT 440 |
5.6 Tom Clancy’s H.A.W.X. 2 (DirectX 11)
HAWX2 is a Direct3D 11 benchmark, promoted by NVIDIA, with tessellation.

Settings: 1920×1080, tessellation ON, AA: 4X
| Avg FPS: 185 – EVGA GTX 580 SC |
| Avg FPS: 185 – ASUS ENGTX580 |
| Avg FPS: 183 – ASUS GTX 570 DirectCU II |
| Avg FPS: 181 – EVGA GTX 480 |
| Avg FPS: 175 – ASUS GeForce GTX 560 Ti DirectCU II TOP |
| Avg FPS: 137 – Sapphire Radeon HD 6970 |
| Avg FPS: 137 – ASUS EAH6870 |
| Avg FPS: 136 – ATI Radeon HD 5870 |
| Avg FPS: 134 – ASUS Radeon HD 6950 DirectCU II |
| Avg FPS: 133 – ASUS Radeon HD 6950 |
| Avg FPS: 132 – Sapphire Radeon HD 6870 |
| Avg FPS: 108 – MSI N460GTX Cyclone 768D5 OC |
| Avg FPS: 98 – MSI R5770 Hawk |
| Avg FPS: 70 – ASUS Radeon HD 6670 |
| Avg FPS: 60 – ASUS GeForce GT 440 |
5.7 MAFIA II (DirectX 9)

MAFIA II is a Direct3D 9 game, that includes a benchmarking tool. I used the high settings:
| 106.5 FPS – EVGA GTX 580 SC |
| 93.4 FPS – EVGA GTX 480 |
| 91.7 FPS – ASUS GTX 570 DirectCU II |
| 89.5 FPS – SAPPHIRE Radeon HD 6970 |
| 88.9 FPS – ASUS GTX 560 Ti DirectCU II |
| 85.1 FPS – ASUS HD 6950 DirectCU II |
| 72.5 FPS – SAPPHIRE Radeon HD 6870 |
| 63.9 FPS – MSI GTX 460 Cyclone |
| 50.2 FPS – MSI R5770 Hawk |
| 48.9 FPS – MSI GeForce GTX 260 |
| 31.7 FPS – ASUS Radeon HD 6670 |
| 26.8 FPS – MSI GeForce 9600 GT Diamond |
| 25.6 FPS – ASUS GT 440 |
ASUS Radeon HD 6670 review index
Great review. Thanks.
This Full HD is a bit funny res, i will better wait for 16:10 LCD / 1920×1200 and prices to comedown.
You say it competes with the GT440 (~75$) and GTS450 (>110$) and costs 100$. Still you only list the GT440 in the benchmarks (which obviously is slower).
To me the numbers give the impression that a GTS450 is the better decision.
@jK: you’re right, according to other tests over the Net, the GTS is a very nice alternative to the HD 6670. But I didn’t talk about the GTS 450 for two reasons: I don’t have a GTS 450 so I can’t compare performances, and the GTS 450 requires an additional power connector. Both GT 440 and HD 6670 do not have power connectors.
Yes and they both have about 12k in 3Dmark06 overall performance and they both have prices bellow 100$, so you won’t be running Physx on full HD so Radeon would be better choice here.
GTS 450 – 1Gb DDR3 99.90€
GT 440 – 1GB DDR5 (slow card) 99.90€
HD 6670 – 1GB DDR5 (fast card) 99.90€
Now who winns?
^^ HD 6670 ^^ ABS THE BIG WINNER
I feel that the power draw conclusion is a bit off.
Idle, total power cons. 92W.
FurMark, total power cons. 194W
(194 – 92) * 0.9 = 92W
That would mean that the CPU and the rest of the system does not use any more power when the GPU is stress tested. I think the 66W TDP is pretty accurate, as the manufacturers have no need to understate those figures. Also, I doubt that the PSU has 90% efficiency at sub 200W.
@Sturla:
Yes, you are correct about the efficiency number. It’s around 0.85 ~ 0.88 at that low wattage. Doing the calculations again, it results that the Radeon 6670 is about 87 ~ 89 watts in full load. Wich isn’t that far off from 92.
But there is one thing you are wrong. Furmark stresses ONLY the GPU. You have normal 1~5% cpu usage while running Furmark so you can’t blame the system using more power during stress test. And even if there were some light usage of CPU, power draw would still be in the range of 80W, somewhat over the limit of what a PCi-Ex can handle. The only con I see to this is that you can’t overclock the card. Other than that, the numbers are perfectly fine 🙂
The review doesn’t speak about CrossfireX potential. I have an A10 based machine and want to know how this will perform in Crossfire. My understanding is that you have to master off the A10, but that you can get theoretical boosts equal to some percentage of this cards performance in cross fire mode, making the machine quite capable for low power and cost. Any attempt to evaluate Crossfire or expectations?