ASUS Radeon HD 6670 review index
- Page 1 – ASUS HD 6670: Presentation
- Page 2 – ASUS HD 6670: Features
- Page 3 – ASUS HD 6670: OpenGL Tests
- Page 4 – ASUS HD 6670: Direct3D Tests
- Page 5 – ASUS HD 6670: Gaming Tests
- Page 6 – ASUS HD 6670: Power Consumption and Temperature
- Page 7 – ASUS HD 6670: Conclusion
4 – ASUS Radeon HD 6670 Direct3D Tests
4.1 Unigine Heaven (DirectX 11)
OpenGL tests have been finished on Unigine Heaven, what a better transition than starting Direct3D tests with Unigine Heaven 2.1, this time using the Direct3D 11 render path.
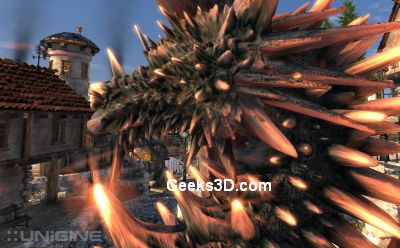
Settings: 1920×1080 fullscreen, tessellation: normal, shaders: high, 4X MSAA, 16X anisotropic filtering.
| 47.9 FPS, Scores: 1208 – EVGA GTX 580 SC |
| 47.6 FPS, Scores: 1200 – ASUS ENGTX580 |
| 42.9 FPS, Scores: 1081 – SAPPHIRE Radeon HD 6970 |
| 41.6 FPS, Scores: 1048 – ASUS GTX 570 DirectCU II |
| 39.4 FPS, Scores: 991 – EVGA GeForce GTX 480 |
| 38.8 FPS, Scores: 979 – ASUS Radeon HD 6950 DC2 |
| 38.3 FPS, Scores: 966 – ASUS Radeon HD 6950 |
| 36.6 FPS, Scores: 9211 – ASUS GeForce GTX 560 Ti DirectCU II TOP |
| 26.8 FPS, Scores: 674 – ATI Radeon HD 5870 |
| 25.9 FPS, Scores: 653 – ASUS EAH6870 |
| 25.3 FPS, Scores: 637 – SAPPHIRE Radeon HD 6870 |
| 25.6 FPS, Scores: 646 – MSI N460GTX Cyclone 768D5 |
| 16.6 FPS, Scores: 419 – MSI R5770 Hawk |
| 12 FPS, Scores: 301 – ASUS Radeon HD 6670 |
| 9.8 FPS, Scores: 247 – ASUS GT 440 |
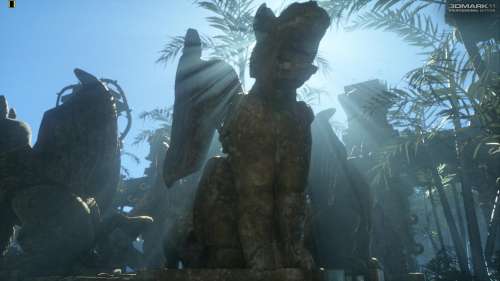
4.2 3DMark11 (Direct3D 11)
3DMark11, Furturemark’s new Direct3D benchmark (see here for more details: 3DMARK11: New Gamer’s Benchmark for DirectX 11 is There (+ Big Pictures)), has been added in Geeks3D’s benchmarks suite for graphics cards reviews.
3DMARK11 Entry mode (1024×600)
| E8463 – EVGA GeForce GTX 580 SC |
| E7931 – ASUS GTX 570 DirectCU II |
| E7598 – EVGA GeForce GTX 480 |
| E7481 – SAPPHIRE Radeon HD 6970 |
| E7287 – ASUS HD 6950 DirectCU II |
| E7137 – MSI R5770 Hawk 2-way CrossFire |
| E6957 – ASUS GeForce GTX 560 Ti DirectCU II TOP |
| E6837 – ASUS Radeon HD 6950 |
| E6285 – ATI Radeon HD 5870 |
| E6206 – SAPPHIRE Radeon HD 6870 |
| E5270 – MSI N460GTX Cyclone 768D5 OC |
| E4166 – ATI Radeon HD 5770 |
| E3030 – ASUS Radeon HD 6670 |
| E2204 – ASUS GT 440 |
3DMARK11 Performance mode (1280×720)
| P5947 – EVGA GeForce GTX 580 SC |
| P5253 – ASUS GTX 570 DirectCU II |
| P5174 – EVGA GeForce GTX 480 |
| P5119 – SAPPHIRE Radeon HD 6970 |
| P4980 – ASUS HD 6950 DirectCU II |
| P4887 – MSI R5770 Hawk 2-way CrossFire |
| E4627 – ASUS Radeon HD 6950 |
| E4521 – ASUS GeForce GTX 560 Ti DirectCU II TOP |
| P4284 – ATI Radeon HD 5870 |
| P4188 – SAPPHIRE Radeon HD 6870 |
| P3251 – MSI N460GTX Cyclone 768D5 OC |
| P2648 – ATI Radeon HD 5770 |
| E1868 – ASUS Radeon HD 6670 |
| E1303 – ASUS GT 440 |
3DMARK11 Extreme mode (1920×1080)
| X2020 – EVGA GeForce GTX 580 SC |
| X1812 – SAPPHIRE Radeon HD 6970 |
| X1717 – ASUS GTX 570 DirectCU II |
| X1672 – EVGA GeForce GTX 480 |
| P1651 – ASUS HD 6950 DirectCU II |
| X1594 – ASUS Radeon HD 6950 |
| X1565 – MSI R5770 Hawk 2-way CrossFire |
| X1565 – ATI Radeon HD 5870 |
| X1518 – ASUS GeForce GTX 560 Ti DirectCU II TOP |
| X1399 – SAPPHIRE Radeon HD 6870 |
| X947 – MSI N460GTX Cyclone 768D5 OC |
| X875 – ATI Radeon HD 5770 |
| E573 – ASUS Radeon HD 6670 |
| X393 – ASUS GT 440 |
4.3 NVIDIA Island Demo: Tessellation (Direct3D 11)
NVIDIA Island demo is a D3D11 demo focused on, what a surprise, tessellation!
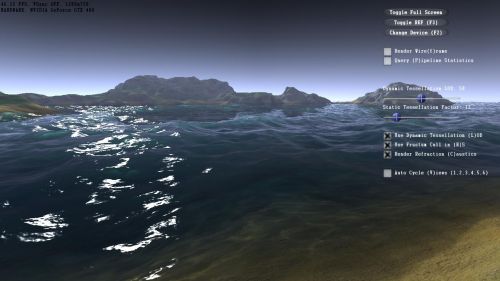
Settings: windowed (default size: 1280×720) and default params (tess factor: 12).
| FPS: 58 – EVGA GTX 580 SC |
| FPS: 57 – ASUS ENGTX580 |
| FPS: 49 – ASUS GTX 570 DirectCU II |
| FPS: 46 – EVGA GTX 480 |
| FPS: 41 – ASUS GeForce GTX 560 Ti DirectCU II TOP |
| FPS: 25 – MSI N460GTX Cyclone 768D5 OC |
| FPS: 15 – Sapphire Radeon HD 6970 |
| FPS: 13 – ASUS EAH6870 |
| FPS: 13 – Sapphire Radeon HD 6870 |
| FPS: 13 – ASUS Radeon HD 6950 |
| FPS: 11 – ASUS GT 440 |
| FPS: 11 – ATI Radeon HD 5870 |
| FPS: 10 – ASUS Radeon HD 6950 DC2 |
| FPS: 10 – MSI R5770 Hawk |
| FPS: 9 – ASUS Radeon HD 6670 |
4.4 NVIDIA Direct3D 11 SDK: SSAO
The SSAO demo features real time screen space ambient occlusion. This demo is included in NVIDIA Direct3D 11 SDK.
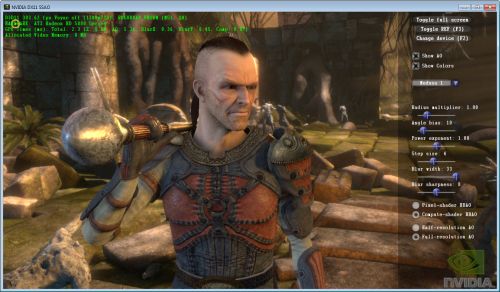
Settings: 1920×1018 windowed with default settings.
| FPS: 185 – SAPPHIRE Radeon HD 5850 |
| FPS: 61 – ASUS Radeon HD 6670 |
ASUS Radeon HD 6670 review index
Great review. Thanks.
This Full HD is a bit funny res, i will better wait for 16:10 LCD / 1920×1200 and prices to comedown.
You say it competes with the GT440 (~75$) and GTS450 (>110$) and costs 100$. Still you only list the GT440 in the benchmarks (which obviously is slower).
To me the numbers give the impression that a GTS450 is the better decision.
@jK: you’re right, according to other tests over the Net, the GTS is a very nice alternative to the HD 6670. But I didn’t talk about the GTS 450 for two reasons: I don’t have a GTS 450 so I can’t compare performances, and the GTS 450 requires an additional power connector. Both GT 440 and HD 6670 do not have power connectors.
Yes and they both have about 12k in 3Dmark06 overall performance and they both have prices bellow 100$, so you won’t be running Physx on full HD so Radeon would be better choice here.
GTS 450 – 1Gb DDR3 99.90€
GT 440 – 1GB DDR5 (slow card) 99.90€
HD 6670 – 1GB DDR5 (fast card) 99.90€
Now who winns?
^^ HD 6670 ^^ ABS THE BIG WINNER
I feel that the power draw conclusion is a bit off.
Idle, total power cons. 92W.
FurMark, total power cons. 194W
(194 – 92) * 0.9 = 92W
That would mean that the CPU and the rest of the system does not use any more power when the GPU is stress tested. I think the 66W TDP is pretty accurate, as the manufacturers have no need to understate those figures. Also, I doubt that the PSU has 90% efficiency at sub 200W.
@Sturla:
Yes, you are correct about the efficiency number. It’s around 0.85 ~ 0.88 at that low wattage. Doing the calculations again, it results that the Radeon 6670 is about 87 ~ 89 watts in full load. Wich isn’t that far off from 92.
But there is one thing you are wrong. Furmark stresses ONLY the GPU. You have normal 1~5% cpu usage while running Furmark so you can’t blame the system using more power during stress test. And even if there were some light usage of CPU, power draw would still be in the range of 80W, somewhat over the limit of what a PCi-Ex can handle. The only con I see to this is that you can’t overclock the card. Other than that, the numbers are perfectly fine 🙂
The review doesn’t speak about CrossfireX potential. I have an A10 based machine and want to know how this will perform in Crossfire. My understanding is that you have to master off the A10, but that you can get theoretical boosts equal to some percentage of this cards performance in cross fire mode, making the machine quite capable for low power and cost. Any attempt to evaluate Crossfire or expectations?