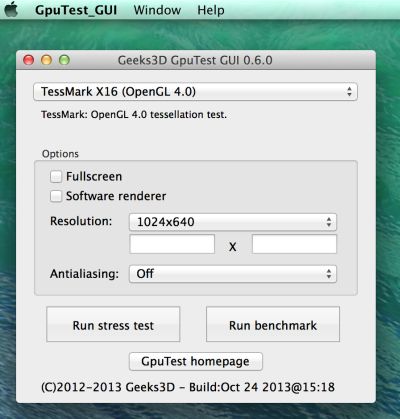
Here are some average scores with GpuTest 0.6.0 that will allow you to check if your GPU is crunching pixels correctly.
Benchmark settings: 1920×1080 fullscreen
Windows 7/8
| FurMark | TessMark X16 | Volplosion | |
| GeForce GTX 780 (R331.65) |
5808 points (96FPS) | 63204 points (1054FPS) | 2659 points (44FPS) |
| GeForce GTX 660 (R327.24) |
2425 points (40FPS) | 38052 points (635FPS) | 1375 points (22FPS) |
| Radeon HD 8570M (Catalyst 13.10 Mobility beta2 Samsung NP740UE3) |
339 points (5FPS) | 5683 points (94FPS) | 218 points (3FPS) |
| Intel HD 4000(Samsung NP740UE3) | 180 points (2FPS) | 2394 points (39FPS) | 182 points (3FPS) |
OSX 10.9
| FurMark | TessMark X16 | Volplosion | |
| GeForce GT 650M (MBPr mid 2012) |
787 points (13FPS) | 7361 points (122FPS) | 364 points (6FPS) |
| Intel HD 4000 (MBPr mid 2012) |
376 points (6FPS) | 2083 points (34FPS) | 79 points (1FPS) |
Linux (Mint 13 64-bit)
| FurMark | TessMark X16 | Volplosion | |
| GeForce GTX 680 (R331.17) |
2837 points (47FPS) | 36551 points (609PS) | 1763 points (29FPS) |