SAPPHIRE Radeon HD 6870 Review Index
- 1 – Meet with SAPPHIRE’s Radeon HD 6870
- 2 – SAPPHIRE Radeon HD 6870 Features
- 3 – SAPPHIRE Radeon HD 6870 OpenGL performances
- 4 – SAPPHIRE Radeon HD 6870 Direct3D performances
- 5 – SAPPHIRE Radeon HD 6870 Gaming performances
- 6 – SAPPHIRE Radeon HD 6870 DirectCompute performances
- 7 – SAPPHIRE Radeon HD 6870 Power consumption and overclocking
- 8 – SAPPHIRE Radeon HD 6870: Misc Links and Reviews
7 – SAPPHIRE Radeon HD 6870 Power consumption and Overclocking (TriXX)
For the power consumption, I used FurMark 1.8.2 and the upcoming FurMark 1.9.0. The graphics workload in the new FurMark 1.9.0 has been slightly increased, leading to more power consumption (few watts in more). But this extra graphics workload can make the difference with high overclocking settings. It was the real first test of the new FurMark 1.9.0 (will be released in few days).
The total power consumption of my testbed in idle is 110W (HD 6870 with default clocks).
With default settings (GPU core: 900MHz, Vcore or VDDC: 1.175V, memory: 1050MHz), the total power consumption of the system is 282W for a max GPU temperature of 85°C (FurMark settings: 1920×1080, fullscreen, Xtreme burn-in, no AA, no postfx).
We can the calculate the power consumption of SAPPHIRE’s HD 6870. The Corsair AX1200 PSU has an efficiency factor of around 0.9 (see this article, there is a graph of the AX1200 efficiency).
P = (282-110) * 0.9
P = 155 watts
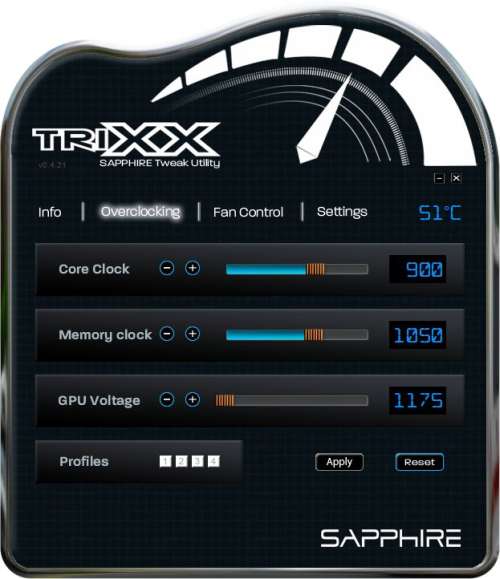
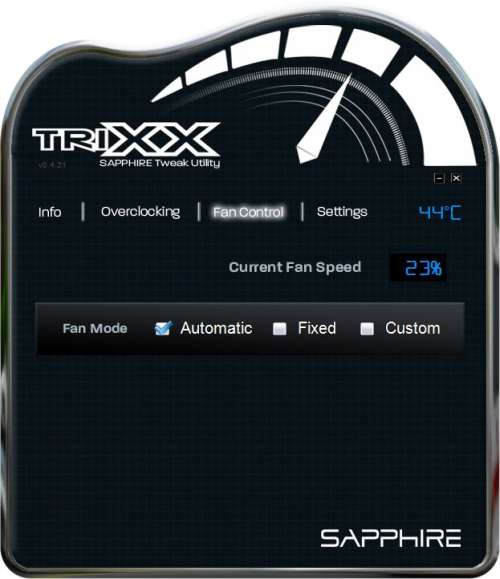
I tested SAPPHIRE TriXX to overclock the ENGTX580. SAPPHIRE sent me the latest 0.4.21 beta version. If you don’t know TriXX, here are some screenshots:
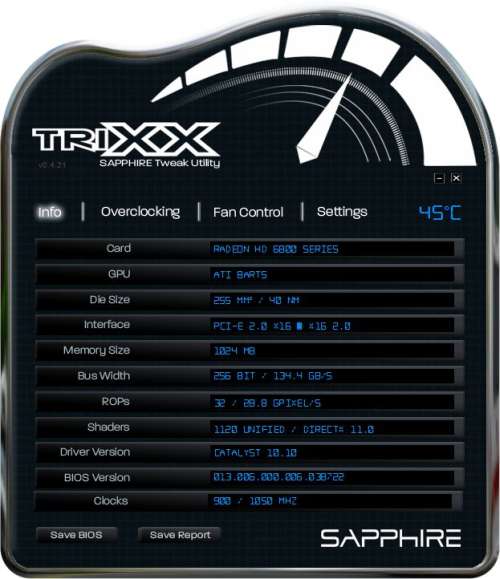
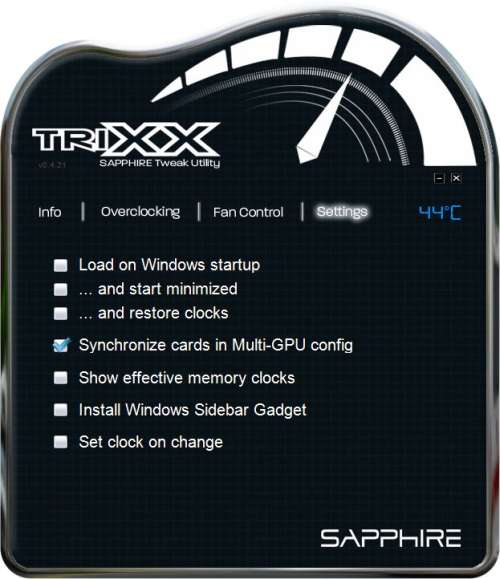
More information about TriXX can be found on TriXX homepage.
So, using TriXX, and by modifying the GPU core clock and the GPU voltage (or Vcore or VDDC), I managed to get a stable value under FurMark for a GPU clock of 1000MHz and a GPU voltage of 1.300V. Cool isn’t it? Okay on other websites, they find values like 1045MHz for the GPU but hey, here at Geeks3D, we use the Xtreme burn-in mode of FurMark and this test is really severe with the hardware. So 1000MHz under FurMark is nice!
Here are some tests I did:
- FurMark 1.8.2, GPU core: 900MHz, Vcore=1.175V. Total power consumption: 282W (HD6870 alone: 155W), GPU temp: 85°C, GPU current: 68A and GPU power draw: 79W
- FurMark 1.8.2, GPU core: 940MHz, Vcore=1.175V. Total power consumption: 288W (HD6870 alone: 160W), GPU temp: 86°C, GPU current: 71A and GPU power draw: 83W
- FurMark 1.8.2, GPU core: 960MHz, Vcore=1.187V. Total power consumption: 296W (HD6870 alone: 167W), GPU temp: 87°C, GPU current: 73A and GPU power draw: 86W
- FurMark 1.8.2, GPU core: 980MHz, Vcore=1.193V: FREEZE!!!
- FurMark 1.8.2, GPU core: 980MHz, Vcore=1.281V. Total power consumption: 333W (HD6870 alone: 200W), GPU temp: 91°C, GPU current: 87A and GPU power draw: 111W
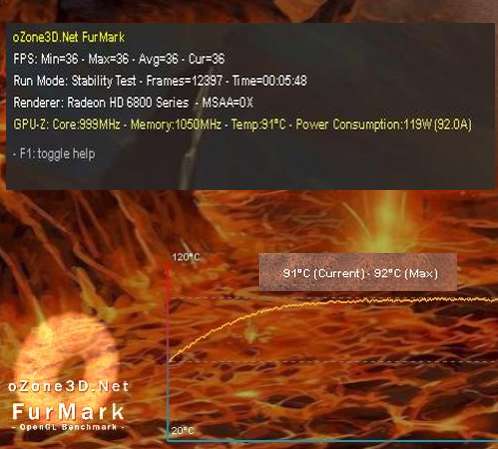
- FurMark 1.8.2, GPU core: 1000MHz, Vcore=1.300V. Total power consumption: 347W (HD6870 alone: 213W), GPU temp: 92°C, GPU current: 92A and GPU power draw: 119W
- FurMark 1.9.0, GPU core: 1000MHz, Vcore=1.300V. Total power consumption: 355W (HD6870 alone: 220W), GPU temp: 94°C, GPU current: 99A and GPU power draw: 128W
As you can see FurMark 1.9.0 is not a toy… Nearly 30 amperes (GPU current) in more for the GPU compared to default clocks. Nothing to say, SAPPHIRE HD 6870 is a card for overclockers.

To reproduce such overclocking test, I recommend you to have some quality hardware, because we exceed the electric specifications of the system. In my case, a GIGABYTE A-UD5 motherboard and a high-end PSU: Corsair’s AX1200!
Here is a comparative table of the power consumption of the card ALONE (not the total power consumption of the system):
| Power: 330W – ASUS ENGTX580 (core: 871MHz, Vcore:1.088V) |
| Power: 290W – ASUS ENGTX580 (default settings) |
| Power: 272W – EVGA GTX 480 |
| Power: 220W – SAPPHIRE Radeon HD 6870 (core: 1000MHz, Vcore: 1.300V) |
| Power: 185W – ATI Radeon HD 5870 |
| Power: 155W – SAPPHIRE Radeon HD 6870 (core: 900MHz, Vcore: 1.175V) |
| Power: 147W – ASUS EAH6870 |
| Power: 135W – MSI N460GTX Cyclone 768D5 OC |
The max total power consumption of SAPPHIRE HD 6870 is 220W while the GPU one is 128W (according to GPU-Z). The difference, 220-128 = 92W, is the power consumption of the rest of the board (especially the VRM).
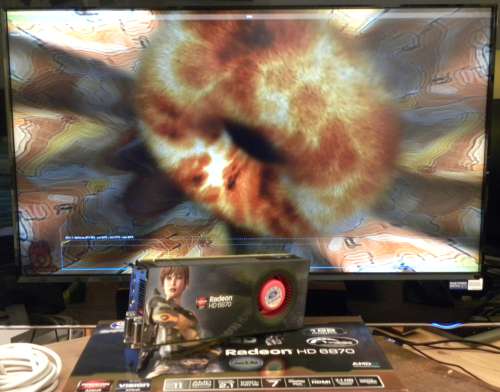
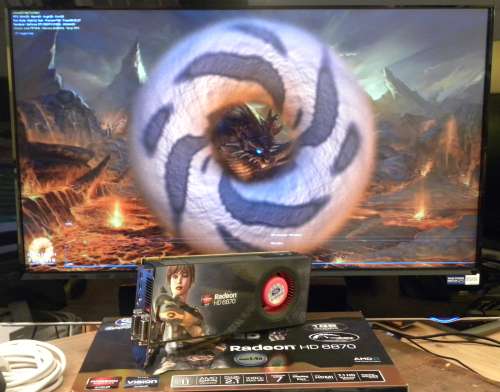
SAPPHIRE HD 6870 and FurMark 1.9.0
SAPPHIRE Radeon HD 6870 Review Index
- 1 – Meet with SAPPHIRE’s Radeon HD 6870
- 2 – SAPPHIRE Radeon HD 6870 Features
- 3 – SAPPHIRE Radeon HD 6870 OpenGL performances
- 4 – SAPPHIRE Radeon HD 6870 Direct3D performances
- 5 – SAPPHIRE Radeon HD 6870 Gaming performances
- 6 – SAPPHIRE Radeon HD 6870 DirectCompute performances
- 7 – SAPPHIRE Radeon HD 6870 Power consumption and overclocking
- 8 – SAPPHIRE Radeon HD 6870: Misc Links and Reviews
GTX 580 for Crysis, where is it?
GTX 580 Crysis score is for the next review. I’m testing a GTX 580 from EVGA…
guys seriously consider putting the index on the bottom of the site too.. using home key is a bit annoying and unfamiliar
@Lokadivu: done!
OK, will you then compare 6870 vs 580 ?
Radeons are fast enough in games, artificial bench demos it’s about the same as Sunspider bench who cares about that.
@iPristy: sure, all previous scores (HD 5870, HD 6870, GTX 4xx) will be in EVGA GTX 580 review.
Pingback: [Tested and Burned] EVGA GeForce GTX 580 SC Review - 3D Tech News, Pixel Hacking, Data Visualization and 3D Programming - Geeks3D.com
Pingback: [GPU Tool] ShaderToyMark 0.2.0 Demomakers’ Benchmark Available with Better SLI and CrossFire Support - 3D Tech News, Pixel Hacking, Data Visualization and 3D Programming - Geeks3D.com
Pingback: AMD Catalyst 10.12 WHQL (OpenGL 4.1, OpenCL 1.1) - 3D Tech News, Pixel Hacking, Data Visualization and 3D Programming - Geeks3D.com
Pingback: [Tested and Burned] SAPPHIRE Radeon HD 6970 2048MB Review - 3D Tech News, Pixel Hacking, Data Visualization and 3D Programming - Geeks3D.com
Pingback: [Tested] ASUS Radeon HD 6950 2GB GDDR5 Review - 3D Tech News, Pixel Hacking, Data Visualization and 3D Programming - Geeks3D.com
Pingback: [Tested and Burned] ASUS GeForce GTX 560 Ti DirectCU II TOP Review - 3D Tech News, Pixel Hacking, Data Visualization and 3D Programming - Geeks3D.com
these opengl tests do not at all reflect the performance of real opengl applications.
when using the latest fermi architecutre in opengl heavy 3d apps like blender, maya and so on the true weakness of these cards emerge.
it would be really great if you could add a test done in blender to the ones yu already did to see how the “real” opengl performance is.