
Article index
- 1 – Overview
- 2 – Gallery
- 3 – GPU information
- 4 – Benchmarks
- 4.1 – 3DMark Sky Diver
- 4.2 – 3DMark FireStrike (1920×1080)
- 4.3 – 3DMark FireStrike Ultra (4K / 3840×2160)
- 4.4 – 3DMark TimeSpy (Direct3D 12)
- 4.5 – Unigine Superposition – 1080p Medium – Direct3D
- 4.6 – Unigine Superposition – 4K Optimized – Direct3D
- 4.7 – Unigine Valley – Extreme HD – Direct3D
- 4.8 – FurMark 1.20
- 4.9 – Rhodium LC
- 4.10 – MSI Kombustor 2017 – TessMark X32 OpenGL
- 4.11 – World of Tanks enCore (Direct3D)
- 4.12 – Final Fantasy XV (Direct3D)
- 4.13 – Resident Evil 6 Benchmark
- 4.14 – Far Cry 5 (Direct3D)
- 4.15 – HashCat 5.0 (OpenCL)
- 5 – Burn-in Test
- 6 – Automatic Overclocking / NV OC Scanner
- 7 – Conclusion
1 – Overview
Finally, the Turing GPU has arrived at Geeks3D’s lab. It was time!
The GeForce RTX 2080 is based on the Turing TU104 GPU. It’s not the most powerful Turing variant (RTX 2080 Ti) but compared to previous generation (Pascal) there is a important leap in performances and in features. In performances because in many cases the RTX 2080 is 30% faster (even more, look at the hashcat/OpenCL test) than the GTX 1080 and in features thanks to new tensor cores (for AI apps and for the new DLSS antialiasing), RT cores (for real time ray tracing), or mesh shading. In this review I will focuse on regular 3D tests and I won’t talk about ray tracing.
The TU104 GPU that powers the RTX 2080 Strix is factory-overclocked: 1515MHz for the base clock (same as reference board) and 1860MHz for the boost clock (+60MHz overclock compared to the ref board). The 8GB of GDDR6 memory (vendor: Samsung) are clocked at 7000MHz (or 1750MHz real speed) like the reference board.
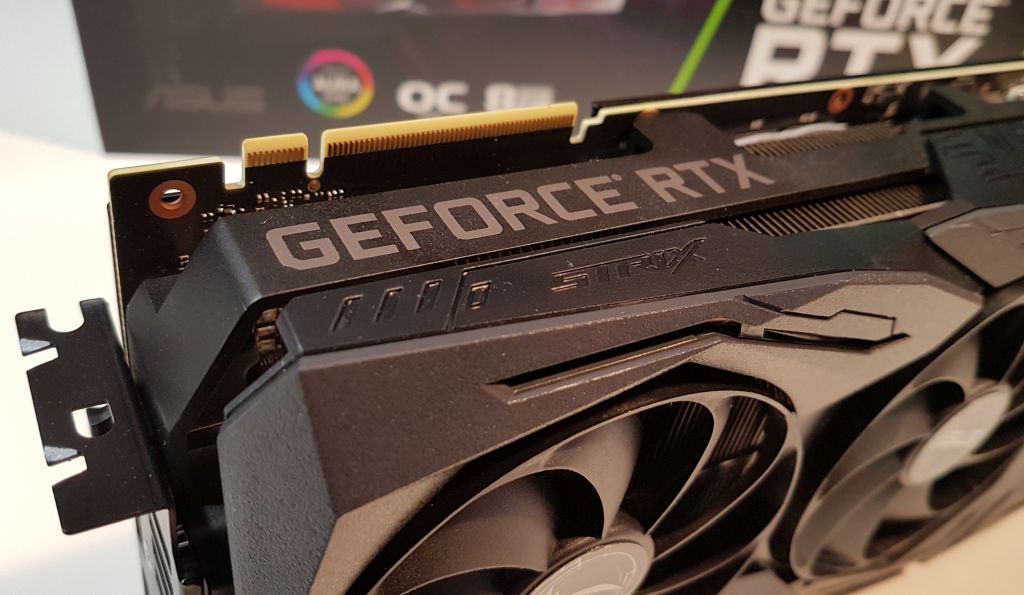
The ROG Strix RTX 2080 is heavy and bulky with its enormous 2.7 slot VGA cooler and its three 85mm fans. The VGA cooler is massive but does its job perfectly as you’re going to see. The Strix also supports the 0dB technology that allows the VGA cooler to be passive (fans are stopped) if the GPU temperature is below 55°C.
The Strix RTX 2080, as many other models from ASUS, supports the AURA RGB lighting technology. AURA lighting can control the lighting of your ASUS graphics card, motherboard and even mouse. Moreover, ASUS is one of the rare manufacturers that provide a SDK allowing programmers to embed AURA lighting into their applications. I added last year the support of AURA lighting to GeeXLab. So you can now control by code the RGB lighting of your Strix (see this article for an overview).
More marketing stuff can be found on the Strix RTX 2080 OC Edition homepage.
2 – Gallery
The box!


The bundle: the graphics card, an install doc and a CDROM. Very very minimal!

Now the real stuff: the RTX 2080!
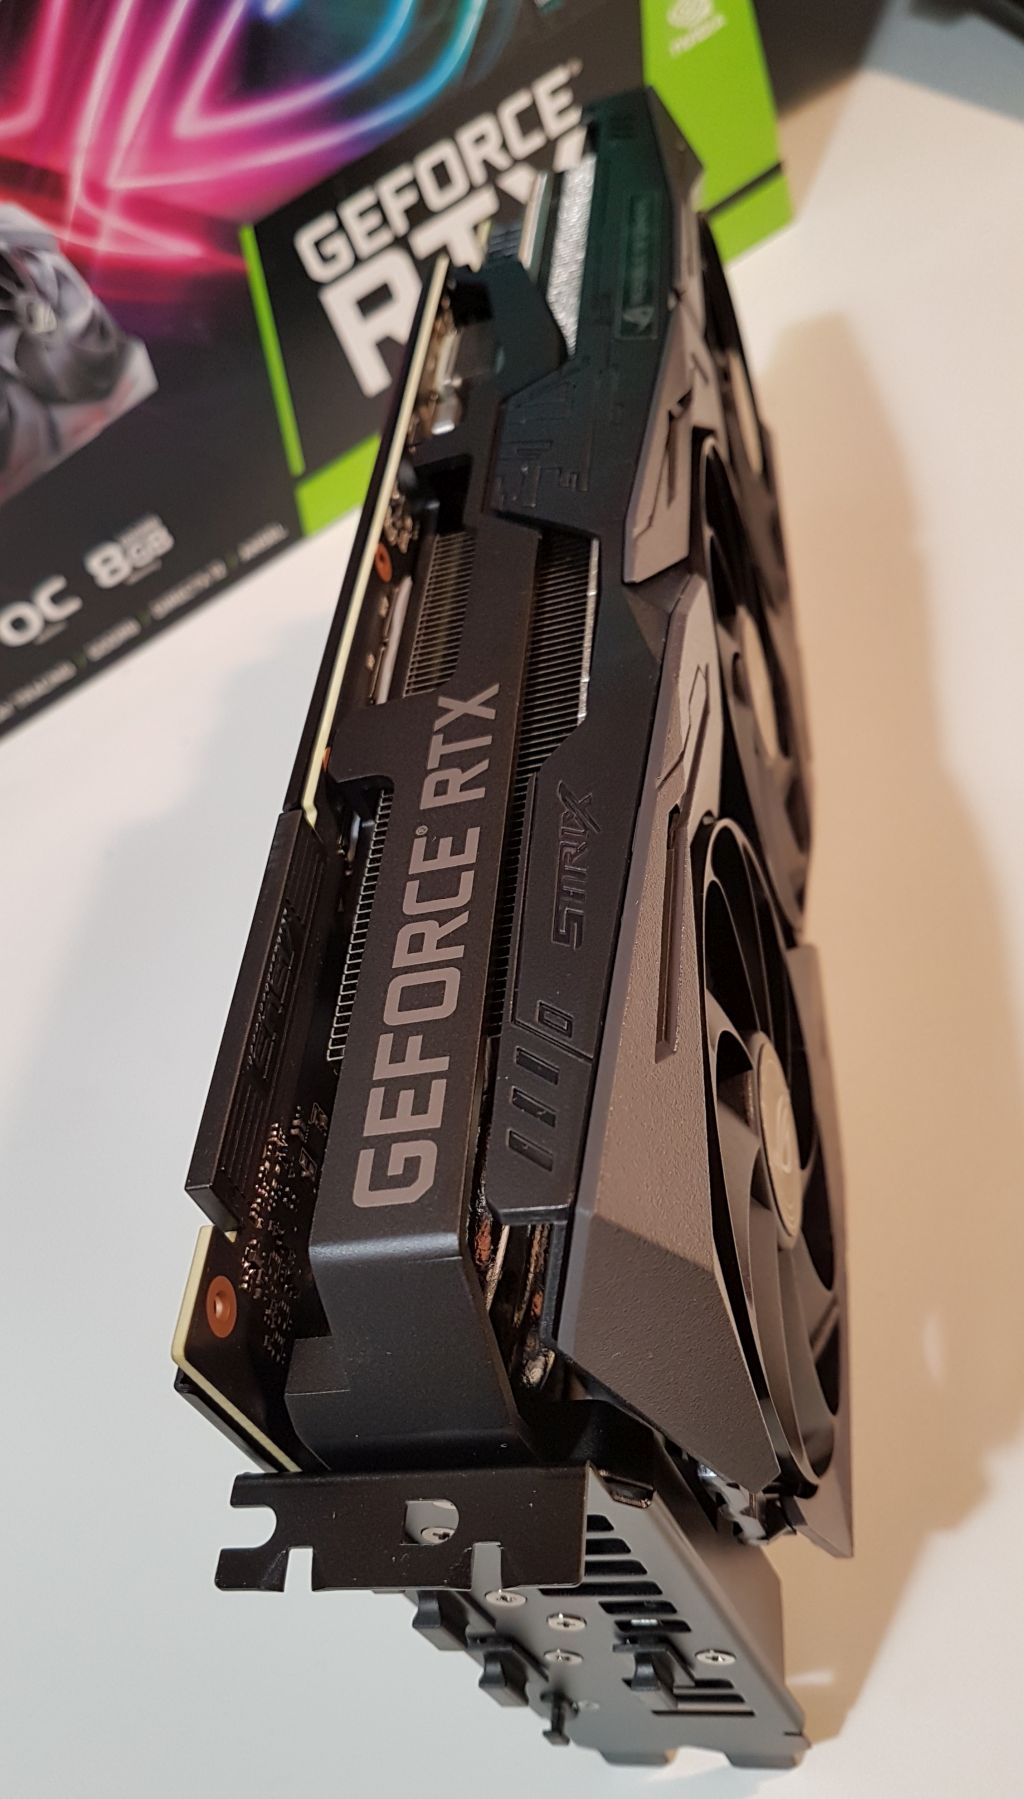
Let’s start with an overview of the beast:


The RTX 2080 Strix has a reinforced frame (the GEFORCE RTX logo is printed on it):
Our engineers have boosted the ROG Strix GeForce® RTX 2080’s structural integrity by 3X with a metal brace that prevents excessive torsion and lateral bending of the PCB.


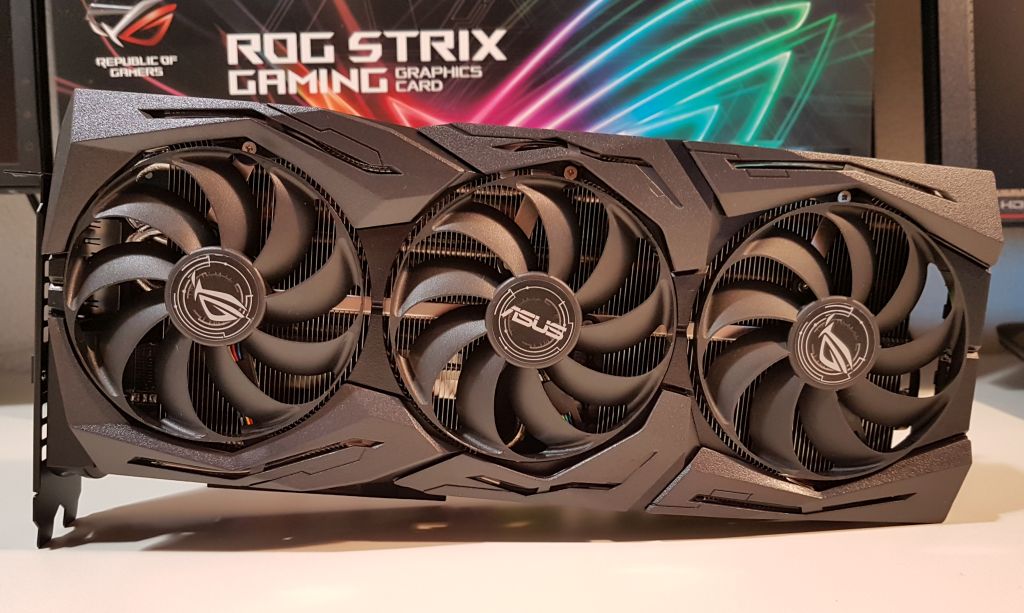
The VGA cooler and its 3 Axial-tech fans:
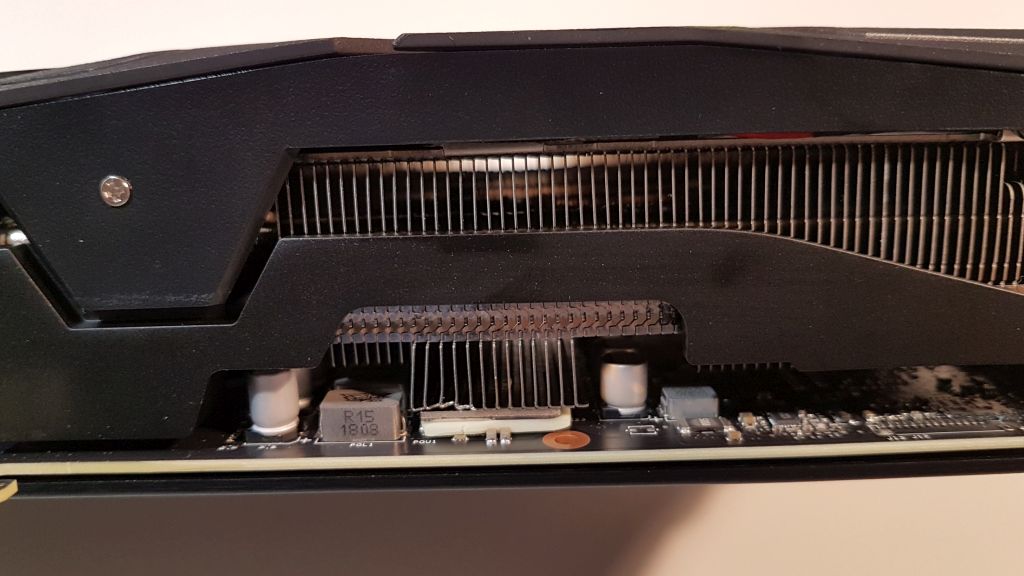
The cooling of the VRM transistors:
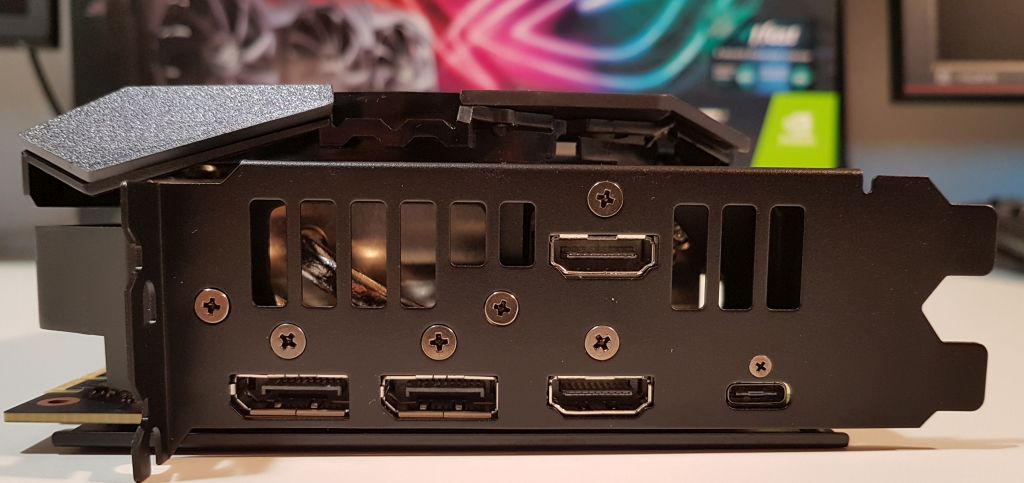
Connectors: 2 X DisplayPort 1.4, 2 X HDMI 2.0b and 1 X USB Type-C
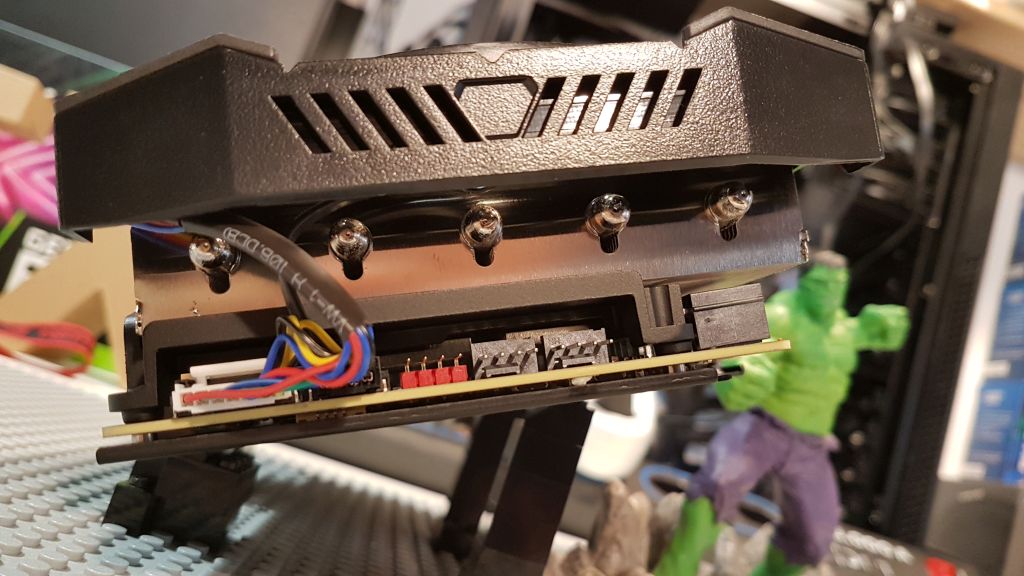
At the end of the card, there is an ugly fan-cable and three free connectors. The red connector is a 4-pin RGB header for an RGB fan or LED strip. The two other connectors are for additional fans.

The rear side of the Strix RTX 2080 is protected by a nice backplate:

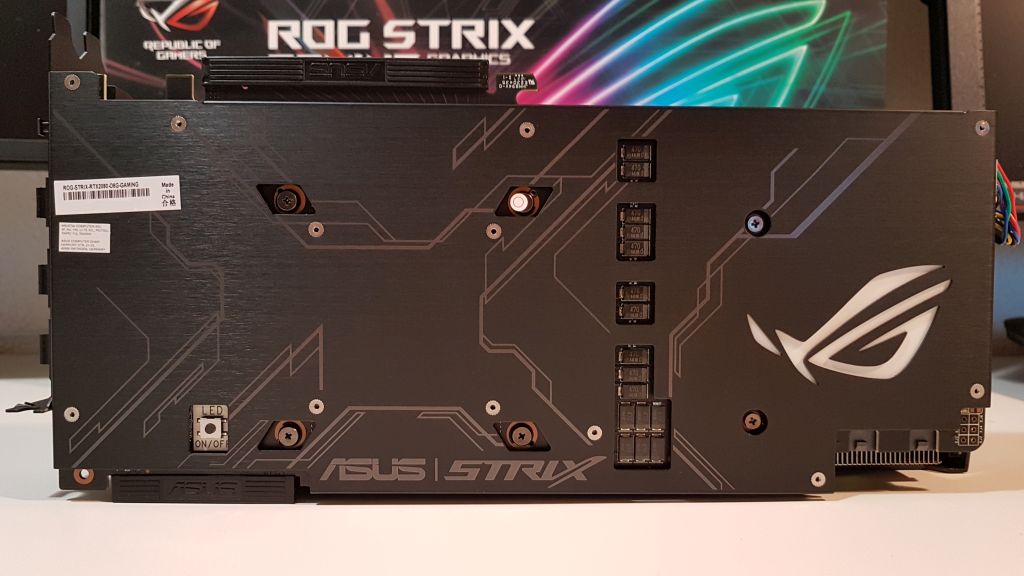
The button for ninjas:
Sometime you just want to turn off all the lights… That’s why we’ve outfitted the ROG Strix GeForce® RTX 2080 with a convenient stealth mode button. Give it a press and you’ll instantly transform from a master of the color-verse into a stealthy ninja.
Ok it’s just a button to quickly turn ON/OFF all RGB lighting of the card…

Dual-BIOS: the RTX 2080 board comes with a dual-BIOS switch to quickly select performance or quiet mode.
Do you prioritize low core temps or low noise levels? Performance mode will let the fans spin up to keep the card running cool all the time. Quiet mode keeps the same power target and top-end settings, but offers a less aggressive fan curve for quieter operation at medium temps. For even more customization and control, check out our GPU Tweak II software.

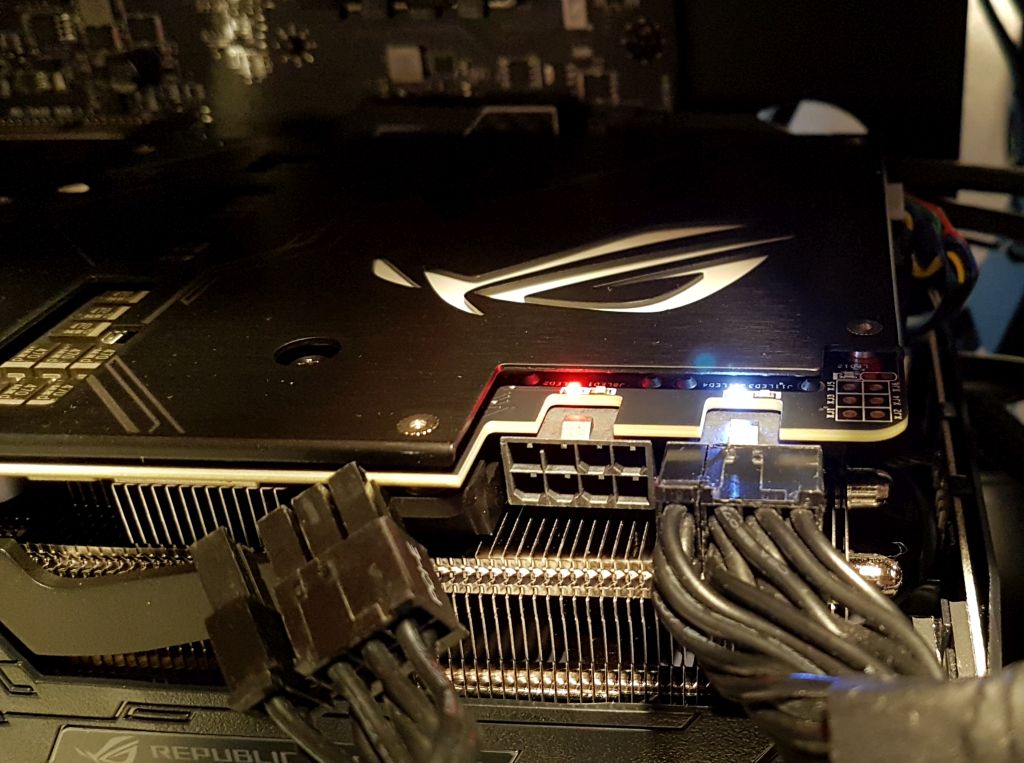
The Strix RTX 2080 has two 8-pin power connectors. That means this RTX board is designed to support up to 375W (150W per power connector + 75W via the PCIe slot) of power consumption.
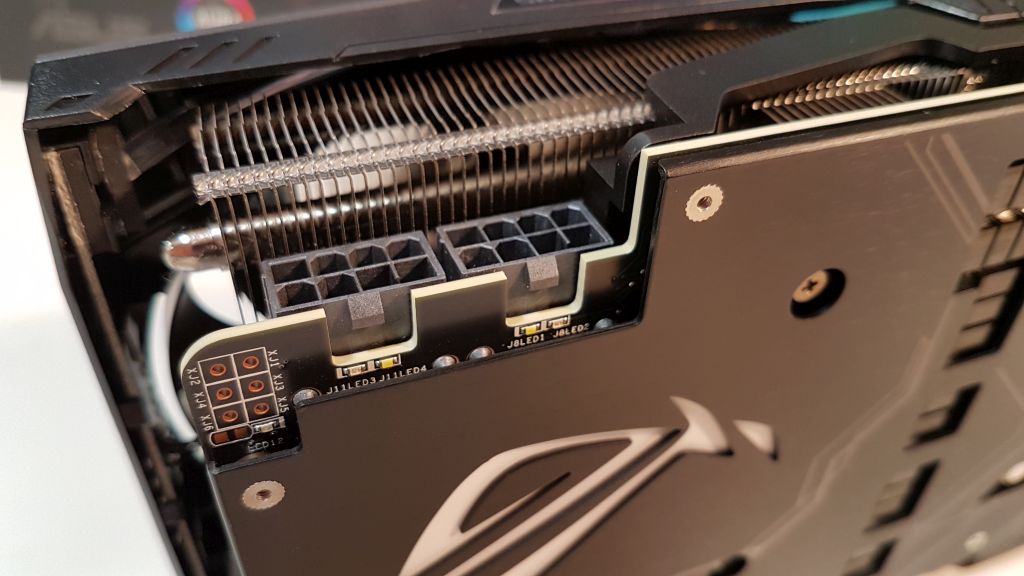
Each power connector has a LED that shows if the power feeding is correct or not:

The new NVLink connector for fast data exchange between several GPUs.
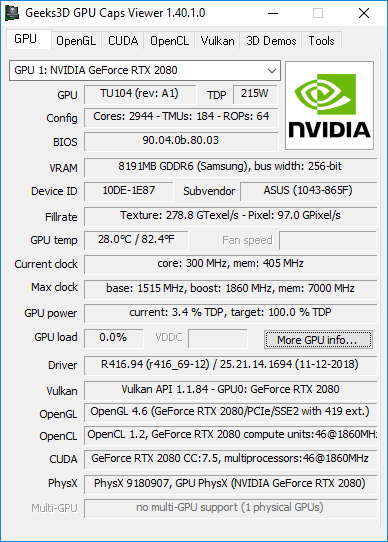
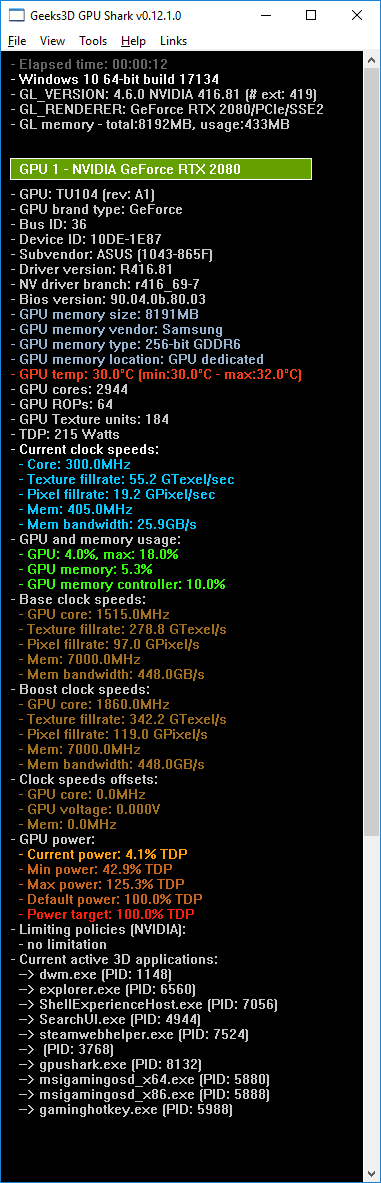
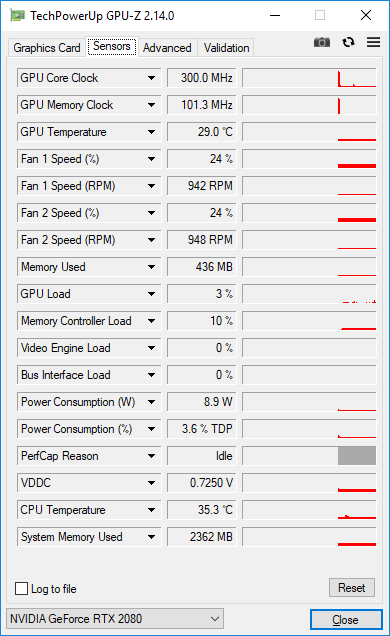
3 – GPU Information
The usual GPU Caps Viewer, GPU Shark and GPU-Z screenshots.


4 – GPU Benchmarks
| Test System | |
|---|---|
| CPU | Intel Core i7-8700K @ 3.7GHz |
| Motherboard | GIGABYTE Z390 Gaming X |
| Memory | 16GB DDR4 Corsair Vengeance LED @ 3000MHz |
| PSU | Corsair AX860i |
| Storage | Samsung 840 Pro 256GB SSD |
| OS | Windows 10 v1809 64-bit |
4.1 – 3DMark Sky Diver
| 48278 (graphics:91140, physics:16624, combined:28892) ASUS ROG Strix GeForce RTX 2080 OC 8GB – GeForce 416.94 |
| 43293 (graphics:71813, physics:16355, combined:28711) ASUS ROG Strix GeForce GTX 1080 OC 8GB – GeForce 416.94 |
| 40120 (graphics:58829, physics:16745, combined:29143) MSI Radeon RX Vega 56 AIR BOOST – Adrenalin 18.11.1 |
| 39287 (graphics:58162, physics:16492, combined:28877) EVGA GeForce GTX 1070 FTW – GeForce 416.94 |
| 32212 (graphics:40542, physics:16557, combined:28694) EVGA GeForce GTX 1060 SC 6GB – GeForce 416.94 |
| 30441 (graphics:36767, physics:16692, combined:28858) MSI Radeon R9 290X – Adrenalin 18.11.1 |
| 29985 (graphics:35749, physics:16838, combined:28889) MSI Radeon RX 470 8GB – Adrenalin 18.11.1 |
| 29740 (graphics:35526, physics:16603, combined:28751) MSI GeForce GTX 970 – GeForce 416.94 |
| 23492 (graphics:25059, physics:16757, combined:27136) MSI Radeon HD 7970 – Adrenalin 18.11.1 |
In this test, the RTX 2080 is 26% faster than the GTX 1080 if we look at the graphics score only.
4.2 – 3DMark FireStrike (1920×1080)
| 22003 (graphics:28030, physics:18578, combined:9419) ASUS ROG Strix GeForce RTX 2080 OC 8GB – GeForce 416.94 |
| 19146 (graphics:22604, physics:18585, combined:9109) ASUS ROG Strix GeForce GTX 1080 OC 8GB – GeForce 416.94 |
| 16504 (graphics:19574, physics:18586, combined:29143) MSI Radeon RX Vega 56 AIR BOOST – Adrenalin 18.11.1 |
| 16414 (graphics:18561, physics:18629, combined:8025) EVGA GeForce GTX 1070 FTW – GeForce 416.94 |
| 11708 (graphics:13426, physics:18640, combined:4651) MSI Radeon R9 290X – Adrenalin 18.11.1 |
| 11538 (graphics:13079, physics:18534, combined:4711) EVGA GeForce GTX 1060 SC 6GB – GeForce 416.94 |
| 11075 (graphics:12839, physics:18597, combined:4201) MSI Radeon RX 470 8GB – Adrenalin 18.11.1 |
| 10292 (graphics:11368, physics:18595, combined:4325) MSI GeForce GTX 970 – GeForce 416.94 |
| 7899 (graphics:8616, physics:18629, combined:3175) MSI Radeon HD 7970 – Adrenalin 18.11.1 |
In this test, the RTX 2080 is 24% faster than the GTX 1080 if we look at the graphics score only.
4.3 – 3DMark FireStrike Ultra (4K / 3840×2160)
| 6680 (graphics:6581, physics:18559, combined:3617) ASUS ROG Strix GeForce RTX 2080 OC 8GB – GeForce 416.94 |
| 5517 (graphics:5446, physics:18595, combined:2819) ASUS ROG Strix GeForce GTX 1080 OC 8GB – GeForce 416.94 |
| 4634 (graphics:4654, physics:18592, combined:2148) MSI Radeon RX Vega 56 AIR BOOST – Adrenalin 18.11.1 |
| 4593 (graphics:4512, physics:18631, combined:2304) EVGA GeForce GTX 1070 FTW – GeForce 416.94 |
| 3117 (graphics:3013, physics:18669, combined:4711) EVGA GeForce GTX 1060 SC 6GB – GeForce 416.94 |
| 2869 (graphics:2830, physics:18652, combined:1325) MSI Radeon RX 470 8GB – Adrenalin 18.11.1 |
| 2681 (graphics:2594, physics:18622, combined:1321) MSI GeForce GTX 970 – GeForce 416.94 |
In this test, the RTX 2080 is 20% faster than the GTX 1080 if we look at the graphics score only.
4.4 – 3DMark TimeSpy (Direct3D 12)
| 10028 (graphics:10725, cpu:7330) ASUS ROG Strix GeForce RTX 2080 OC 8GB – GeForce 416.94 |
| 7524 (graphics:7562, cpu:7316) ASUS ROG Strix GeForce GTX 1080 OC 8GB – GeForce 416.94 |
| 6284 (graphics:6144, cpu:7218) MSI Radeon RX Vega 56 AIR BOOST – Adrenalin 18.11.1 |
| 6284 (graphics:6131, cpu:7324) EVGA GeForce GTX 1070 FTW – GeForce 416.94 |
| 4524 (graphics:4244, cpu:7239) EVGA GeForce GTX 1060 SC 6GB – GeForce 416.94 |
| 4259 (graphics:3966, cpu:7338) MSI Radeon R9 290X – Adrenalin 18.11.1 |
| 3957 (graphics:3660, cpu:7330) MSI Radeon RX 470 8GB – Adrenalin 18.11.1 |
| 3814 (graphics:3515, cpu:7368) MSI GeForce GTX 970 – GeForce 416.94 |
In this test, the RTX 2080 is 41% faster than the GTX 1080 if we look at the graphics score only.
4.5 – Unigine Superposition – 1080p Medium – Direct3D
| 20795 (avg FPS: 155.5) ASUS ROG Strix GeForce RTX 2080 OC 8GB – GeForce 416.94 |
| 16419 (avg FPS: 122.8) ASUS ROG Strix GeForce GTX 1080 OC 8GB – GeForce 416.94 |
| 13039 (avg FPS: 97.5) EVGA GeForce GTX 1070 FTW – GeForce 416.94 |
| 12078 (avg FPS: 90.3) MSI Radeon RX Vega 56 AIR BOOST – Adrenalin 18.11.1 |
| 9082 (avg FPS: 67.9) EVGA GeForce GTX 1060 SC 6GB – GeForce 416.94 |
| 8290 (avg FPS: 62) MSI Radeon R9 290X – Adrenalin 18.11.1 |
| 7469 (avg FPS: 55.9) MSI GeForce GTX 970 – GeForce 416.94 |
| 7127 (avg FPS: 53.3) MSI Radeon RX 470 8GB – Adrenalin 18.11.1 |
| 5332 (avg FPS: 39.9) MSI Radeon HD 7970 – Adrenalin 18.11.1 |
In this test, the RTX 2080 is 26% faster than the GTX 1080.
4.6 – Unigine Superposition – 4K Optimized – Direct3D
| 9069 (avg FPS: 67.8) ASUS ROG Strix GeForce RTX 2080 OC 8GB – GeForce 416.94 |
| 7014 (avg FPS: 52.5) ASUS ROG Strix GeForce GTX 1080 OC 8GB – GeForce 416.94 |
| 5639 (avg FPS: 42.2) EVGA GeForce GTX 1070 FTW – GeForce 416.94 |
| 5060 (avg FPS: 37.8) MSI Radeon RX Vega 56 AIR BOOST – Adrenalin 18.11.1 |
| 3886 (avg FPS: 29.1) EVGA GeForce GTX 1060 SC 6GB – GeForce 416.94 |
| 3026 (avg FPS: 22.6) MSI Radeon RX 470 8GB – Adrenalin 18.11.1 |
In this test, the RTX 2080 is 29% faster than the GTX 1080.
4.7 – Unigine Valley – Extreme HD – Direct3D
Unigine Valley is a Direct3D/OpenGL benchmark from the same dev team than Unigine Heaven. More information can be found HERE and HERE.

Settings: Extreme HD (Direct3D 11, 1920×1080 fullscreen, 8X MSAA)
| 5594 (avg FPS: 133.7) ASUS ROG Strix GeForce RTX 2080 OC 8GB – GeForce 416.94 |
| 4645 (avg FPS: 111.0) ASUS ROG Strix GeForce GTX 1080 OC 8GB – GeForce 416.94 |
| 3953 (avg FPS: 94.5) EVGA GeForce GTX 1070 FTW – GeForce 416.94 |
| 3106 (avg FPS: 74.2) MSI Radeon RX Vega 56 AIR BOOST – Adrenalin 18.11.1 |
| 2853 (avg FPS: 68.2) EVGA GeForce GTX 1060 SC 6GB – GeForce 416.94 |
| 2695 (avg FPS: 64.4) MSI Radeon R9 290X – Adrenalin 18.11.1 |
| 2414 (avg FPS: 57.7) MSI GeForce GTX 970 – GeForce 416.94 |
| 1967 (avg FPS: 47.0) MSI Radeon RX 470 8GB – Adrenalin 18.11.1 |
| 1730 (avg FPS: 41.4) MSI Radeon HD 7970 – Adrenalin 18.11.1 |
In this test, the RTX 2080 is 18% faster than the GTX 1080.
4.8 – FurMark 1.20
P1080 (1920×1080)
| 10203 (avg FPS: 170) ASUS ROG Strix GeForce RTX 2080 OC 8GB – GeForce 416.94 |
| 7322 (avg FPS: 122) ASUS ROG Strix GeForce GTX 1080 OC 8GB – GeForce 416.94 |
| 6691 (avg FPS: 112) MSI Radeon RX Vega 56 AIR BOOST – Adrenalin 18.11.1 |
| 6201 (avg FPS: 103) EVGA GeForce GTX 1070 FTW – GeForce 416.94 |
| 4946 (avg FPS: 83) MSI Radeon R9 290X – Adrenalin 18.11.1 |
| 4556 (avg FPS: 76) EVGA GeForce GTX 1060 SC 6GB – GeForce 416.94 |
| 3845 (avg FPS: 64) MSI GeForce GTX 970 – GeForce 416.94 |
| 3367 (avg FPS: 56) MSI Radeon RX 470 8GB – Adrenalin 18.11.1 |
| 3246 (avg FPS: 54) MSI Radeon HD 7970 – Adrenalin 18.11.1 |
In this test, the RTX 2080 is 39% faster than the GTX 1080.
P2160 (3840×2160)
| 3817 (avg FPS: 64) ASUS ROG Strix GeForce RTX 2080 OC 8GB – GeForce 416.94 |
| 2734 (avg FPS: 46) ASUS ROG Strix GeForce GTX 1080 OC 8GB – GeForce 416.94 |
| 2261 (avg FPS: 38) MSI Radeon RX Vega 56 AIR BOOST – Adrenalin 18.11.1 |
| 2217 (avg FPS: 37) EVGA GeForce GTX 1070 FTW – GeForce 416.94 |
| 1600 (avg FPS: 27) MSI Radeon R9 290X – Adrenalin 18.11.1 |
| 1556 (avg FPS: 26) EVGA GeForce GTX 1060 SC 6GB – GeForce 416.94 |
| 1330 (avg FPS: 22) MSI GeForce GTX 970 – GeForce 416.94 |
| 1071 (avg FPS: 18) MSI Radeon HD 7970 – Adrenalin 18.11.1 |
| 1030 (avg FPS: 17) MSI Radeon RX 470 8GB – Adrenalin 18.11.1 |
In this test, the RTX 2080 is 39% faster than the GTX 1080.
4.9 – Rhodium LC
Rhodium LC (LC for Liquid Carbon!) is a new GPU pixel shader benchmark made with GeeXLab and based on this shadertoy demo. You can download RhodiumLC from THIS PAGE.

P1080 (1920×1080)
| 4853 (avg FPS: 80) ASUS ROG Strix GeForce RTX 2080 OC 8GB – GeForce 416.94 |
| 3650 (avg FPS: 60) ASUS ROG Strix GeForce GTX 1080 OC 8GB – GeForce 416.94 |
| 2835 (avg FPS: 47) EVGA GeForce GTX 1070 FTW – GeForce 416.94 |
| 2640 (avg FPS: 43) MSI Radeon RX Vega 56 AIR BOOST – Adrenalin 18.11.1 |
| 1923 (avg FPS: 32) EVGA GeForce GTX 1060 SC 6GB – GeForce 416.94 |
| 1484 (avg FPS: 24) MSI GeForce GTX 970 – GeForce 416.94 |
| 1418 (avg FPS: 23) MSI Radeon R9 290X – Adrenalin 18.11.1 |
| 1192 (avg FPS: 19) MSI Radeon RX 470 8GB – Adrenalin 18.11.1 |
| 937 (avg FPS: 15) MSI Radeon HD 7970 – Adrenalin 18.11.1 |
In this test, the RTX 2080 is 32% faster than the GTX 1080.
P2160 (3840×2160)
| 1269 (avg FPS: 21) ASUS ROG Strix GeForce RTX 2080 OC 8GB – GeForce 416.94 |
| 930 (avg FPS: 15) ASUS ROG Strix GeForce GTX 1080 OC 8GB – GeForce 416.94 |
| 735 (avg FPS: 12) EVGA GeForce GTX 1070 FTW – GeForce 416.94 |
| 669 (avg FPS: 11) MSI Radeon RX Vega 56 AIR BOOST – Adrenalin 18.11.1 |
| 497 (avg FPS: 8) EVGA GeForce GTX 1060 SC 6GB – GeForce 416.94 |
| 378 (avg FPS: 6) MSI GeForce GTX 970 – GeForce 416.94 |
| 305 (avg FPS: 5) MSI Radeon RX 470 8GB – Adrenalin 18.11.1 |
| 302 (avg FPS: 5) MSI Radeon R9 290X – Adrenalin 18.11.1 |
| 231 (avg FPS: 3) MSI Radeon HD 7970 – Adrenalin 18.11.1 |
In this test, the RTX 2080 is 36% faster than the GTX 1080.
I know this benchmark is tough, even for the RTX 2080 😉
4.10 – MSI Kombustor 2017 – TessMark X32 OpenGL
MSI Kombustor 2017 (v0.6.2.0) is the new version of MSI Kombustor. For this test, I used TessMark X32 which is an OpenGL 4.0 tessellation benchmark with a tessellation level of 32. You can download MSI Kombustor 2017 from THIS PAGE.

P1080 (1920×1080)
| 16248 (avg FPS: 270) ASUS ROG Strix GeForce RTX 2080 OC 8GB – GeForce 416.94 |
| 13515 (avg FPS: 225) ASUS ROG Strix GeForce GTX 1080 OC 8GB – GeForce 416.94 |
| 10440 (avg FPS: 173) EVGA GeForce GTX 1070 FTW – GeForce 416.94 |
| 8845 (avg FPS: 147) MSI Radeon RX Vega 56 AIR BOOST – Adrenalin 18.11.1 |
| 7106 (avg FPS: 118) EVGA GeForce GTX 1060 SC 6GB – GeForce 416.94 |
| 6992 (avg FPS: 116) MSI Radeon RX 470 8GB – Adrenalin 18.11.1 |
| 6288 (avg FPS: 105) MSI GeForce GTX 970 – GeForce 416.94 |
| 1886 (avg FPS: 32) MSI Radeon R9 290X – Adrenalin 18.11.1 |
| 1669 (avg FPS: 28) MSI Radeon HD 7970 – Adrenalin 18.11.1 |
In this test, the RTX 2080 is 20% faster than the GTX 1080.
4.11 – World of Tanks enCore (Direct3D)
World of Tanks enCore is a new graphics benchmark based on the game World of Tanks. More information about this benchmark can be found HERE.

P1080 (1920×1080)
| 34887 ASUS ROG Strix GeForce RTX 2080 OC 8GB – GeForce 416.94 |
| 30453 ASUS ROG Strix GeForce GTX 1080 OC 8GB – GeForce 416.94 |
| 25112 EVGA GeForce GTX 1070 FTW – GeForce 416.94 |
| 21658 MSI Radeon RX Vega 56 AIR BOOST – Adrenalin 18.11.1 |
| 17832 EVGA GeForce GTX 1060 SC 6GB – GeForce 416.94 |
| 16394 MSI GeForce GTX 970 – GeForce 416.94 |
| 15257 MSI Radeon R9 290X – Adrenalin 18.11.1 |
| 13465 MSI Radeon RX 470 8GB – Adrenalin 18.11.1 |
| 9347 MSI Radeon HD 7970 – Adrenalin 18.11.1 |
In this test, the RTX 2080 is 14% faster than the GTX 1080.
P2160 (3840×2160)
| 13236 ASUS ROG Strix GeForce RTX 2080 OC 8GB – GeForce 416.94 |
| 10495 ASUS ROG Strix GeForce GTX 1080 OC 8GB – GeForce 416.94 |
| 8310 EVGA GeForce GTX 1070 FTW – GeForce 416.94 |
| 7609 MSI Radeon RX Vega 56 AIR BOOST – Adrenalin 18.11.1 |
| 5779 EVGA GeForce GTX 1060 SC 6GB – GeForce 416.94 |
| 5590 MSI Radeon R9 290X – Adrenalin 18.11.1 |
| 4572 MSI Radeon RX 470 8GB – Adrenalin 18.11.1 |
In this test, the RTX 2080 is 26% faster than the GTX 1080.
4.12 – Final Fantasy XV (Direct3D)
This benchmark is based on the Final Fantasy XV Windows Edition video game. More information HERE.

P1080
Settings: High Quality – 1920×1080 fullscreen
| 10629 ASUS ROG Strix GeForce RTX 2080 OC 8GB – GeForce 416.94 |
| 8778 ASUS ROG Strix GeForce GTX 1080 OC 8GB – GeForce 416.94 |
| 7124 EVGA GeForce GTX 1070 FTW – GeForce 416.94 |
| 5842 MSI Radeon RX Vega 56 AIR BOOST – Adrenalin 18.11.1 |
| 5140 EVGA GeForce GTX 1060 SC 6GB – GeForce 416.94 |
| 4408 MSI GeForce GTX 970 – GeForce 416.94 |
| 3770 MSI Radeon R9 290X – Adrenalin 18.11.1 |
| 3669 MSI Radeon RX 470 8GB – Adrenalin 18.11.1 |
| 2268 MSI Radeon HD 7970 – Adrenalin 18.11.1 |
In this test, the RTX 2080 is 21% faster than the GTX 1080.
P2160
Settings: High Quality – 3840×2160 fullscreen
| 4854 ASUS ROG Strix GeForce RTX 2080 OC 8GB – GeForce 416.94 |
| 3687 ASUS ROG Strix GeForce GTX 1080 OC 8GB – GeForce 416.94 |
| 2925 EVGA GeForce GTX 1070 FTW – GeForce 416.94 |
| 2683 MSI Radeon RX Vega 56 AIR BOOST – Adrenalin 18.11.1 |
| 2089 EVGA GeForce GTX 1060 SC 6GB – GeForce 416.94 |
| 1630 MSI Radeon RX 470 8GB – Adrenalin 18.11.1 |
| 1569 MSI Radeon R9 290X – Adrenalin 18.11.1 |
In this test, the RTX 2080 is 31% faster than the GTX 1080.
4.13 – Resident Evil 6 Benchmark
Resident Evil 6 (RE6) is a Direct3D 9 benchmark. RE6 benchmark can be downloaded from this page.

P1080
Settings: Resolution: 1920 x 1080, anti-aliasing: FXAA3HQ, all params to high.
| 27422 ASUS ROG Strix GeForce RTX 2080 OC 8GB – GeForce 416.94 |
| 26157 ASUS ROG Strix GeForce GTX 1080 OC 8GB – GeForce 416.94 |
| 24683 EVGA GeForce GTX 1070 FTW – GeForce 416.94 |
| 20382 MSI Radeon RX Vega 56 AIR BOOST – Adrenalin 18.11.1 |
| 19779 EVGA GeForce GTX 1060 SC 6GB – GeForce 416.94 |
| 16970 MSI GeForce GTX 970 – GeForce 416.94 |
| 14629 MSI Radeon R9 290X – Adrenalin 18.11.1 |
| 13270 MSI Radeon RX 470 8GB – Adrenalin 18.11.1 |
| 10384 MSI Radeon HD 7970 – Adrenalin 18.11.1 |
In this test, the RTX 2080 is 4% faster than the GTX 1080.
P2160
Settings: Resolution: 3840 x 2160, anti-aliasing: FXAA3HQ, all params to high.
| 15463 ASUS ROG Strix GeForce RTX 2080 OC 8GB – GeForce 416.94 |
| 12483 ASUS ROG Strix GeForce GTX 1080 OC 8GB – GeForce 416.94 |
| 9994 EVGA GeForce GTX 1070 FTW – GeForce 416.94 |
| 7688 MSI Radeon RX Vega 56 AIR BOOST – Adrenalin 18.11.1 |
| 6831 EVGA GeForce GTX 1060 SC 6GB – GeForce 416.94 |
| 5751 MSI GeForce GTX 970 – GeForce 416.94 |
| 5276 MSI Radeon R9 290X – Adrenalin 18.11.1 |
| 4855 MSI Radeon RX 470 8GB – Adrenalin 18.11.1 |
In this test, the RTX 2080 is 24% faster than the GTX 1080.
4.14 – Far Cry 5 (Direct3D)
This test is based on the built-in benchmark shipped with Far Cry 5. More information HERE.

Graphics settings in Far Cry 5: Ultra Quality
P1080
| 6910 frames (117 FPS) ASUS ROG Strix GeForce RTX 2080 OC 8GB – GeForce 416.94 |
| 6483 frames (110 FPS) ASUS ROG Strix GeForce GTX 1080 OC 8GB – GeForce 416.94 |
| 5833 frames (99 FPS) MSI Radeon RX Vega 56 AIR BOOST – Adrenalin 18.11.1 |
| 5605 frames (95 FPS) EVGA GeForce GTX 1070 FTW – GeForce 416.94 |
| 4278 frames (73 FPS) EVGA GeForce GTX 1060 SC 6GB – GeForce 416.94 |
| 3661 frames (62 FPS) MSI GeForce GTX 970 – GeForce 416.94 |
| 3654 frames (62 FPS) MSI Radeon RX 470 8GB – Adrenalin 18.11.1 |
| 3479 frames (59 FPS) MSI Radeon R9 290X – Adrenalin 18.11.1 |
| 2855 frames (48 FPS) MSI Radeon HD 7970 – Adrenalin 18.11.1 |
In this test, the RTX 2080 is 6% faster than the GTX 1080.
P2160
| 3485 frames (59 FPS) ASUS ROG Strix GeForce RTX 2080 OC 8GB – GeForce 416.94 |
| 2642 frames (45 FPS) ASUS ROG Strix GeForce GTX 1080 OC 8GB – GeForce 416.94 |
| 2253 frames (38 FPS) MSI Radeon RX Vega 56 AIR BOOST – Adrenalin 18.11.1 |
| 2097 frames (36 FPS) EVGA GeForce GTX 1070 FTW – GeForce 416.94 |
| 1471 frames (25 FPS) EVGA GeForce GTX 1060 SC 6GB – GeForce 416.94 |
| 1321 frames (22 FPS) MSI Radeon RX 470 8GB – Adrenalin 18.11.1 |
In this test, the RTX 2080 is 31% faster than the GTX 1080.
4.15 – HashCat 5.0 (OpenCL)
hashcat is a OpenCL-based password cracker. More information on hashcat can be found in this article.
You can download the latest HashCat for Windows HERE.
For this review, I used the built-in benchmark and tested the MD5 and SHA-256 performances.
For testing the MD5 perfs, run the following command:
> hashcat64.exe -b -m 0
For testing the SHA-256 perfs, run the following command:
> hashcat64.exe -b -m 1400
MD5
| 42306 MH/sec ASUS ROG Strix GeForce RTX 2080 OC 8GB – GeForce 416.94 |
| 26206 MH/sec ASUS ROG Strix GeForce GTX 1080 OC 8GB – GeForce 416.94 |
| 20713 MH/sec MSI Radeon RX Vega 56 AIR BOOST – Adrenalin 18.11.1 |
| 19866 MH/sec EVGA GeForce GTX 1070 FTW – GeForce 416.94 |
| 11633 MH/sec MSI Radeon R9 290X – Adrenalin 18.11.1 |
| 11595 MH/sec EVGA GeForce GTX 1060 SC 6GB – GeForce 416.94 |
| 10433 MH/sec MSI GeForce GTX 970 – GeForce 416.94 |
| 10354 MH/sec MSI Radeon RX 470 8GB – Adrenalin 18.11.1 |
In this test, the RTX 2080 is 61% faster than the GTX 1080.
SHA-256
| 5775 MH/sec ASUS ROG Strix GeForce RTX 2080 OC 8GB – GeForce 416.94 |
| 3365 MH/sec MSI Radeon RX Vega 56 AIR BOOST – Adrenalin 18.11.1 |
| 3295 MH/sec ASUS ROG Strix GeForce GTX 1080 OC 8GB – GeForce 416.94 |
| 2465 MH/sec EVGA GeForce GTX 1070 FTW – GeForce 416.94 |
| 1811 MH/sec MSI Radeon R9 290X – Adrenalin 18.11.1 |
| 1606 MH/sec MSI Radeon RX 470 8GB – Adrenalin 18.11.1 |
| 1471 MH/sec EVGA GeForce GTX 1060 SC 6GB – GeForce 416.94 |
| 1302 MH/sec MSI GeForce GTX 970 – GeForce 416.94 |
In this test, the RTX 2080 is 71% faster than the GTX 1080.
5 – Burn-in Test

This burn-in test has been done with FurMark 1.20.1.0.
As usual, the first thing to do before running a stress test is to set to the max the power target limit. I used ASUS GPU Tweak II 1.6.7.0 for this job. The RTX 2080 Strix has a max power limit of 125% TDP (value read in GPU Shark and in GPU Tweak). So I set the power limit to 125% TDP using GPU Tweak. If you don’t set the power limit to the max, the GPU is throttled when FurMark is running. I also did a test with default power limit (100%TDP).

Idle state
– total power consumption: 53W
– GPU temperature: 29°C
Load state – 100% TDP
– total power consumption: 341W
– GPU temperature: 63°C
Load state – 125% TDP
– total power consumption: 405W
– GPU temperature: 68°C
A rough estimation of the power consumption of the RTX 2080 Strix is:
– at 100% TDP
P = (341-53-20) * 0.9
P = 241W
– at 125% TDP
P = (405-53-20) * 0.9
P = 298W
where 0.9 is the efficiency factor of the Corsair AX 860i PSU and 20 is an estimation of the additional CPU load when FurMark is running.
These numbers looks coherent with the theoretical TDP: 250W.
The GPU temperature reached a max value of 68°C which is very nice. The massive VGA cooler of the RTX 2080 Strix does its job very well and what’s more, it does it quietly. Amazing!
Thermal imaging
idle state

load state

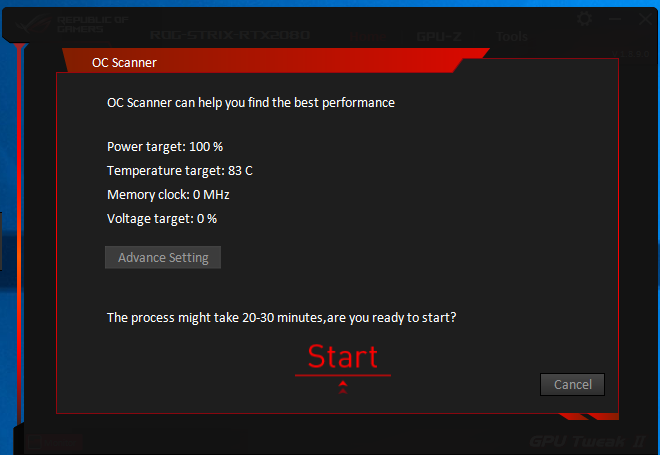
6 – Automatic Overclocking / NV OC Scanner
With Turing GPU, NVIDIA provided to graphics cards makers a library (NV OC Scanner) to automatically find stable overclocking settings. EVGA Precision, MSI Afterburner or ASUS GPU Tweak II have all added this feature.
Since it’s a review about an ASUS graphics card, let’s use ASUS GPU Tweak II. The new OC Scanner function is available in ASUS GPU Tweak II v1.8.9.0+. You can download the latest version of GPU Tweak from THIS LINK.
To start the automatic overclocking, just click on the OC Scanner button. The scanner runs during around 10 minutes and at the end displays the result. In my case, GPU Tweak found +107MHz.


If you’re ok with the value found by the OC Scanner, just click on Apply.
I did a quick performance test with 4.9 – Rhodium LC in 1920×1080 and here is the result:
– default boost frequency: 4853 points (80.9 FPS)
– overclocked boost frequency (+107MHz): 5109 points (85 FPS) => +5%.
7 – Conclusion
During this review I had to upgrade my testbed. Why? Because with my previous testbed based on an AMD Ryzen 7 1700, I got very abnormal results showing sometimes a RTX 2080 slower than a GTX 1080 or even than a GTX 1070! I suspected the Ryzen CPU and I was right! I upgraded the test bench setup with an Intel Core i7-8700K + a Z390 motherboard and things got back to the normal.
The RTX 2080 is a beast at eating pixels and crunching numbers! And such a beast must work with a powerful CPU. In my case, the Ryzen 7 1700, even with its 8 cores / 16 threads was not enough fast for delivering commands to the RTX 2080. The Core i7-8700K with its 6 cores / 12 threads does that job perfectly!
Moreover, the RTX 2080 is so fast at computing 3D graphics that in some benchmarks, there is only a small difference in speed between the RTX 2080 and the GTX 1080. In these cases, we have clearly a CPU-bound situation. If you plan to run 3D graphics and games at full HD resolutions (1920×1080), the RTX 2080 is just overkill: a GTX 1080 is enough and perfectly suited. Higher resolutions such as 4K (3840×2160) are the realm of the RTX 2080. In 4K, the RTX 2080 is more or less 30% faster than the GTX 1080.
In GPU-intensive tasks, such has TimeSpy, FurMark, or RhodiumLC, the difference in performance with the GTX 1080 is very visible: +36% in RhodiumLC, +39% in FurMark and +41% in 3DMark TimeSpy. In GPU computing tasks, the difference is more important: up to +70% in hashcat!
In 4K gaming (Far Cry 5, Final Fantasy XV, World of Tanks enCore) the RTX 2080 is 30% faster than the GTX while it’s not the case in full HD gaming. For example, the RTX 2080 is only 6% faster than a GTX 1080 in Far Cry 5 @ 1920×1080! In the same situation with the Ryzen 7 1700, the RTX 2080 was slower than the GTX 1080.
ASUS Strix RTX 2080 is a nice card and I really like its finishing (except the ugly fan cable). The backplate, the reinforced frame and the imposing VGA cooler (next-gen DirectCU cooler) give you the feeling that the card can resist to anything. The VGA cooler is quiet in idle state and thanks to 0dB technology (enabled with the dual-bios switch on the PCB), the card is passive in idle state if the GPU temperature does not exceed 55°C. With serious graphics loads, we can hear the fans, but it’s really acceptable.
And real time ray tracing? NVIDIA RTX/DXR??? I will talk about real time ray tracing with the GeForce RTX as soon as I will have coded some tests in
Final words: the RTX 2080 (as well as the RTX 2080 Ti) is a extremely powerful graphics card but it requires a powerful CPU. No mercy. This ultra processing power could it explain the excessive price?

Hello Jegx,
i really hope that you read this and maybe can help me!
I have really Issues with the RTX 2080 Card – i have my 3rd Card now and also switched Motherboard,CPU ,RAM and even PSU to test.
But I still have Stuttering while Gaming – Benchmarks seems fine.
I have almost a very similar setup like yours in this Test:
I7-8700K
ASUS STRIX-F Z390
ASUS Strix 2080OC
G.SKILL TRIDENTZ 3200 DDR4 /16
Windows 10 64 BIT 1809
Seasonic 750W
Could you maybe make a Video and show your Frametimes while playing BFV with DX11?
Or CS:GO?
I have frametime spikes going up to 30-50ms
You would really help me!
Have you tried to update the bios on your motherboard? And remember to set her XMP profile on your ram? Give it a shot and try a clean install of windows 10 version 1809.
Always download the newest driver from Nvidias website. Make sure its not a beta.
You can download it from here https://www.heidoc.net/php/Windows-ISO-Downloader.exe
Hope this helps. Take care.
Hello all,
I have exactly the same issue. I have stuttering of FPS in Dota2 and PUBG. My FPS is capped to 120 and stable for minutes but then it drops to 50 for a second and then up again….. Feels like i am lagging but i am not. I have tried.
Uninstall ASUS Aura software
Disable FPS counter
Reinstalled Dota on other drive (HDD/SSD)
Disabled auto Overclocking
Installed latest Windows 10 Updates
Tried with another monitor and an other cable on an other port (HDMI/DisplayPort)
Updated all drivers NVIDIA, BIOS, everything
Tried G-sync ON and OFF
——————————————-
ASUS Strix 2080OC
Seasonic 650W
i7-8700K
G.SKILL TRIDENTZ 3200 DDR4 /32
970 EVO M.2