dxProf and NVIDIA Island demo (D3D11)
A new version of dxProf is available. dxProf is a profiling tool for Direct3D 9, 10 and 11 applications.
dxProf is a command line utility:
dxprof.exe your_app.exe your_app_params
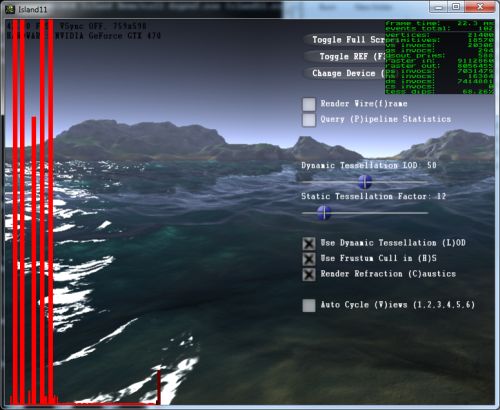
dxProf injects itself into applications that use Direct3D API for rendering. It analyzes each draw call in every frame and displays performance statistics for those draw calls, overlaying it over application frame buffer.
And if you have the .pdb file, dxprof is able to report file and line for draw calls.
You can download dxProf here: dxProf 1.0.8 (zip archive).
dxProf 1.0.8 changelog:
– Fixes crash when minimizing target application
– Added merging of sequential events with identical callstack