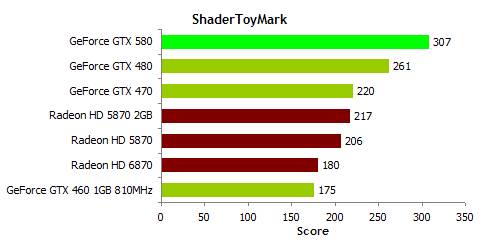
ShaderToyMark score – 960×540 windowed, single GPU
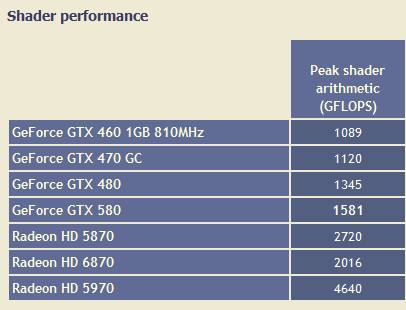
The guys at The Tech Report have tested the GeForce GTX 580 with ShaderToyMark 0.1.0. The interesting thing is that ShaderToyMark seems to nicely reflect the peak shader arithmetic (GFLOPS):
– GTX 580: 1581 GFLOPS
– GTX 480: 1343 GFLOPS
ratio = 1581 / 1343 = 1.17
These values are also confirmed by Hardware.fr here: Dossier : Nvidia GeForce GTX 580 and SLI
And there is exactly the same ratio with ShaderToyMark scores:
– GTX 580: 307 points
– GTX 480: 261 points
ratio = 307 / 261 = 1.17
And what about AMD’s scores ?
You may be looking between the peak arithmetic rates in table at the top of the page and the results above and scratching your head, but the outcome will be no surprise to those familiar with these GPU architectures. The vast SIMD arrays on AMD’s chips do indeed have higher peak theoretical rates, but their execution units can’t always be scheduled as efficiently as Nvidia’s. In this case, the GTX 580 easily outperforms the single-GPU competition. Unfortunately, this test isn’t multi-GPU compatible, so we had to leave out those configs.
I have to fix the multi-GPU bug in ShaderToyMark (from my tests, ShaderToyMark works fine in SLI but crashes in CrossFire).
wow great tool, great tests.. i can only get score 204 and my GTX 460 @940/1880/4600MHz..
very nice! great benchmark.. and btw, radeon Peak Shader Arithmetics is very very impressive!
yeah indeed, looking forward radeon 6970 score, that will be overwhealming! 🙂
Why are you testing between nVidia and AMD .. When the result always is that nVidia is better .. Completely meaningless test.
Awesome! I hit 388 (average 64 fps) with my OC Asus GTX 580. Cool tool!