I guess I found the explanation of the spikes in temperature monitoring graphs that some users have noticed with FurMark. Yesterday, a new beta version of MSI Afterburner 2.0 has been published and in the release notes, we can read:
Added optional data filtering mode for all hardware monitoring graphs. Now it is possible to enable special math data filtering algorithm independently for each hardware monitoring graph to reject misreading spikes caused by sensor access conflicts when running multiple hardware monitoring tools at the same time
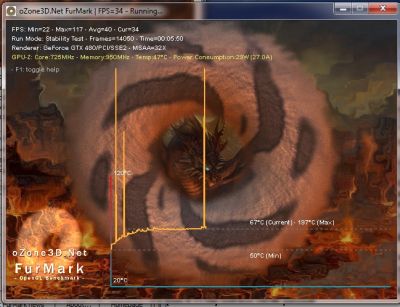
If you look at the screenshot at the beginning of the post, you’ll notice that GPU-Z is running and FurMark displays GPU-Z data. But at the same time, FurMark uses ZoomGPU to read GPU temperature and display the monitoring graph. So from time to time, there is certainly a conflict between GPU-Z and ZoomGPU because both tools want to access to the same sensors at the same time… And this is not limited to GPU-Z or ZoomGPU but to all hardware monitoring utilities.
Then, I will update shortly all my tools (FurMark, TessMark, FluidMark, ZoomGPU, GPU Shark, GPU Caps View) with a spike filter that will use some complex math routines ( if gpu_temp > temp_max then spike! ) 😉
Now a question: why these multiple accesses are not handled by the graphics driver?
Maybe, actually, the graphics driver properly handles multiple sensor readings but only if these readings are done with official driver API functions. Now if a tool performs some kind of low level sensor access, maybe this access is invisible for the driver and that could explain the spikes…
[…]Then, I will update shortly all my tools (FurMark, TessMark, FluidMark, ZoomGPU, GPU Shark, GPU Caps View) with a spike filter that will use some complex math routines ( if gpu_temp > temp_max then spike! )[…]
Complex math routines ?
Maybe just a simple check between two consecutive values, which should not differ more than a certain threshold … (some values in your graphic are below the maximum value “temp_max)
It was a joke regarding Afterburner release notes “Now it is possible to enable special math data filtering algorithm…” 😉
*****
Now a question: why these multiple accesses are not handled by the graphics driver?
Maybe, actually, the graphics driver properly handles multiple sensor readings but only if these readings are done with official driver API functions. Now if a tool performs some kind of low level sensor access, maybe this access is invisible for the driver and that could explain the spikes…
*****
When developing something for us in the past, Franck Delattre said “There is a conflict with notebook manufacturers monitoring tool. I will create a MutEx so that me and future developers will not experience this conflict again”.
Pingback: Geeks3D Weekly Round-up (2010.08.28) - 3D Tech News, Pixel Hacking, Data Visualization and 3D Programming - Geeks3D.com