WebGL Inspector is a debugger and profiler for WebGL. Here are the main features of WebGL Inspector:
- Embed in an existing application with a single script include
- Use as an extension without changing target code
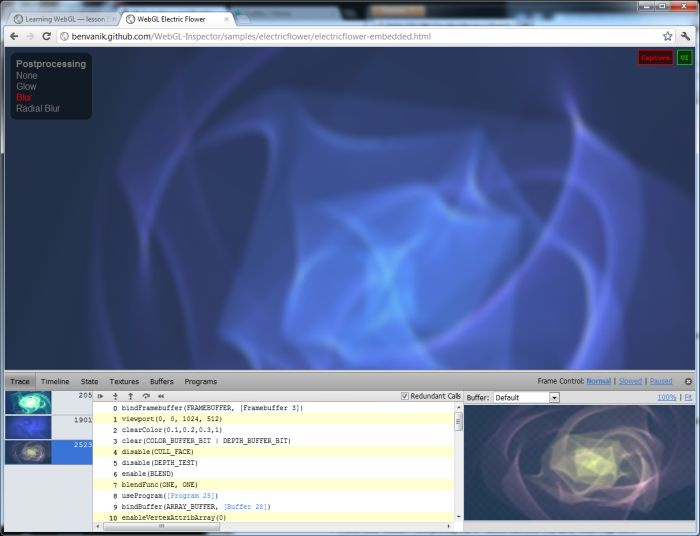
- Capture entire frames of GL activity
- Annotated call log with redundant call warnings
- Ability to step through all calls in a frame incrementally (back/forward/jump/etc)
- Pixel history – see all draw calls that contributed to a pixel + blending information
- Non-destructive to host page – everything happens in a separate GL context
- Internal GL state display
- Resource information (textures/buffers/programs/shaders)
- Performance tuning options and statistics
More information is available HERE.
You can install the latest version 1.9 of WebGL Inspector using this link (Chrome/Chromium extension).