GeeXLab 0.9.5.0 comes with one cool new feature: the support of NanoVG.
NanoVG is a really cool library and a nice addition to GeeXLab. NanoVG is a small C library for drawing antialiased 2D vector graphics. It’s the perfect tool for UI (user interfaces) and 2D visualization.
I added the support of NanoVG in GeeXLab on all platforms including Raspberry Pi:
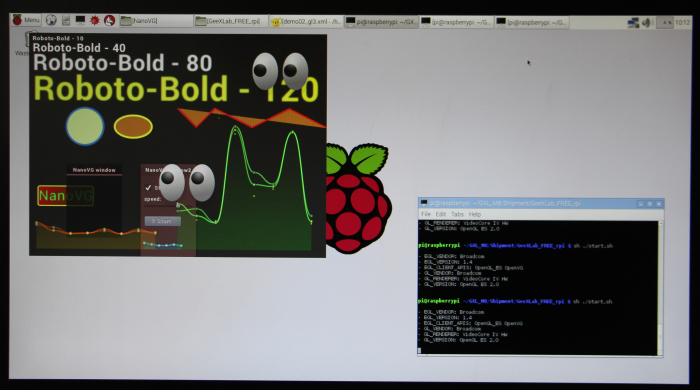
All NanoVG demos are available in the host_api/NanoVG/ folder of the code sample pack. So do not hesitate to tweak and hack them to understand how to use NanoVG related functions. I will update the reference guide as soon as possible.
The support comes with two types of functions: low level functions and high level functions. All new functions are packed in the new gh_nvg (lua / python) library. Low level functions follow NanoVG functions and allow to build any kind of 2D graphics.
First thing to know is that many features of NanoVG are based on the stencil buffer. So you have to enable it by reserving some bits in the depth buffer (stencil data is stored in the depth buffer). By default GeeXLab sets a 32-bit depth buffer (in that case, there is no room for the stencil buffer). To enable both depth and stencil buffers, you have to initialize the demo with the following XML code:
<window name="win3d01" title="NanoVG Test" width="1024" height="768"
        gl_version_major="3" gl_version_minor="2"
        depth_bits="24" />
...
This code reserves 24-bit for the depth buffer and 8-bit (32-24=8) for the stencil buffer.
The first function to call the NanoVG initialization (INIT script)
gh_nvg.init(1)
In the TERMINATE script, you have to call:
gh_nvg.terminate()
In a FRAME script, you have to begin and finish your NanoVG code with:
gh_nvg.begin_frame(winW, winH, 1.0)

...
...
...

gh_nvg.end_frame()
Now let’s see how to draw shapes and other widgets. To draw a shape with NanoVG, you have to start a new path with gh_nvg.begin_path(). This function clears all the currently defined paths. begin_path is not required for text rendering.
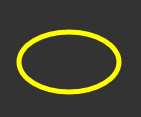
Here is the low level code to draw an ellipse:
local pos_x=..., pos_y=...
gh_nvg.begin_path()
gh_nvg.ellipse(50, 30, pos_x, pos_y)
local stroke_width = 5.0
gh_nvg.stroke(1.0, 1.0, 0.0, 1.0, stroke_width);
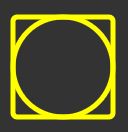
A path can have several shapes. For example an ellipse and a rounded rectangle:
gh_nvg.begin_path()
gh_nvg.ellipse(50, 50, 400, 250)
gh_nvg.rounded_rect(400-50, 250-50, 100, 100, 4.0)
gh_nvg.stroke(1.0, 1.0, 0.0, 1.0, 5.0);
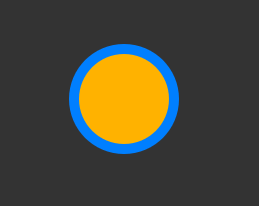
The following circle is rendered with:
local pos_x=..., pos_y=...
gh_nvg.begin_path()
gh_nvg.circle(50, pos_x, pos_y)
gh_nvg.fill_color(1.0, 0.7, 0.0, 1.0); -- orange
local stroke_width = 10.0
gh_nvg.stroke(0.0, 0.5, 1.0, 1.0, stroke_width); -- blue
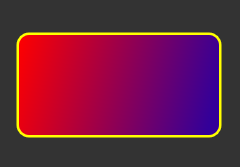
The following rounded rectangle is produced by this code:
local pos_x=..., pos_y=...
gh_nvg.begin_path()
local corner_radius = 10.0
gh_nvg.rounded_rect(pos_x, pos_y, 200, 100, corner_radius)
local stroke_width = 5.0
gh_nvg.stroke(1.0, 1.0, 0.0, 1.0, stroke_width);
gh_nvg.fill_paint_linear_gradient(25, 450, 225, 500,    1.0, 0.0, 0.0, 1.0,     0.2, 0.0, 0.6, 1.0)
NanoVG allows to load a true type font and to draw text. To load a font, use this code:
local demo_dir = gh_utils.get_demo_dir()
gh_nvg.load_font("sans-bold", demo_dir .. "/Roboto-Bold.ttf")
where “sans-bold” is your identifier to use this particular font for drawing texts.
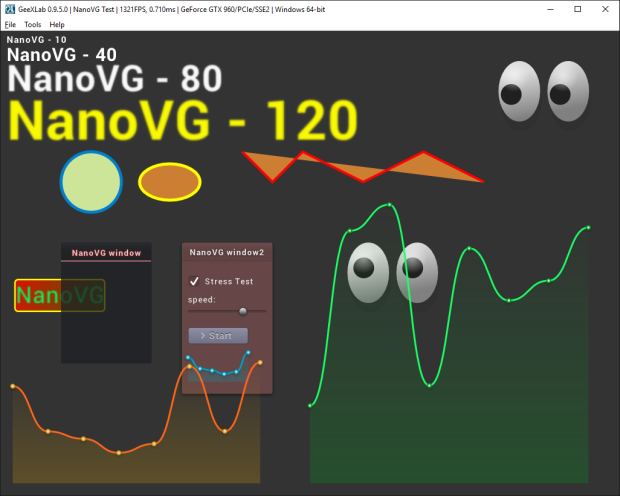
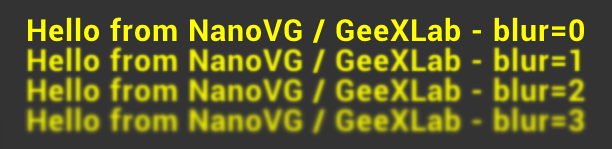
Drawing a text is simple. Here is a function to easily draw some text:
function TextDraw(size, font_name, align_flags, r, g, b, a, x, y, text, blur)
  local NVG_ALIGN_LEFT = 1<<0
  gh_nvg.text_params(align_flags, 1.0, 1.0)
  gh_nvg.font_params(size, font_name, blur)
  gh_nvg.fill_color(r, g, b, a)
  gh_nvg.text(x, y, text)
end

TextDraw(40, "sans-bold", NVG_ALIGN_LEFT, 1, 1, 0, 1, 50, 50, "Hello from NanoVG / GeeXLab - blur=0", 0.0)
TextDraw(40, "sans-bold", NVG_ALIGN_LEFT, 1, 1, 0, 1, 50, 80, "Hello from NanoVG / GeeXLab - blur=1", 1.0)
TextDraw(40, "sans-bold", NVG_ALIGN_LEFT, 1, 1, 0, 1, 50, 110, "Hello from NanoVG / GeeXLab - blur=2", 2.0)
TextDraw(40, "sans-bold", NVG_ALIGN_LEFT, 1, 1, 0, 1, 50, 140, "Hello from NanoVG / GeeXLab - blur=3", 3.0)
The blur option is really cool!
The gh_nvg lib has also high level functions. This functions pack several calls to NanoVG native functions to easily draw widgets like windows, sliders or buttons.
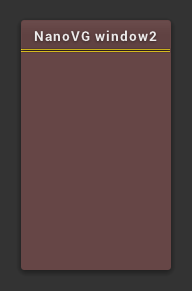
Let's draw a window:
gh_nvg.window_draw_v2("NanoVG window2", 300, 350, 150, 250, 1.0, 0.5, 0.5, 0.25, 1.0, 1.0, 1.0, 0.9)
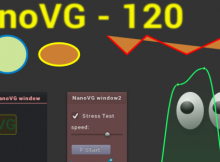
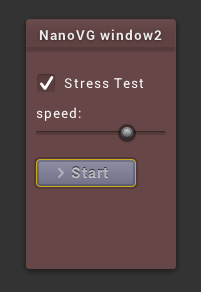
And now, let's add some widgets: label, slider, checkbox and button:
gh_nvg.window_draw_v2("NanoVG window2", 300, 350, 150, 250,     1.0, 0.5, 0.5, 0.25,      1.0, 1.0, 1.0, 0.9)
gh_nvg.check_box_draw(300+10, 350+50, 130, 28, 1, "Stress Test",   1.0, 1.0, 1.0, 1.0,    1.0, 1.0, 1.0, 1.0)
gh_nvg.label_draw("speed:", 300+10, 350+80, 130, 28,     1.0, 1.0, 1.0, 1.0)
gh_nvg.slider_draw(0.7, 300+10, 350+100, 130, 28,    1.0, 1.0, 1.0, 1.0)

local NVG_ICON_SEARCH = 128269
local NVG_ICON_CIRCLED_CROSS = 10006
local NVG_ICON_CHEVRON_RIGHT = 59230
local NVG_ICON_CHECK = 10003
local NVG_ICON_LOGIN = 59200
local NVG_ICON_TRASH = 59177
gh_nvg.button_draw(NVG_ICON_CHEVRON_RIGHT, "Start", 300+10, 350+140, 100, 28,  0.5, 0.5, 0.6, 1)
As you can see, it's quite easy to get a nice tool window:
The gh_nvg lib includes also functions to draw lines and bezier curves. The following 2D bezier-based curve function is a direct port of NanoVG C code sample to GeeXLab Lua code:
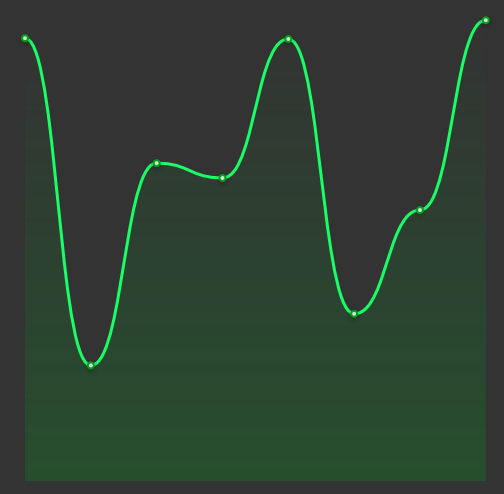
function drawGraph(x, y, w, h, t,    r0,g0,b0,    r1,g1,b1)

  local samples = {}
  samples[1] = (1 + math.sin(t*1.2345 + math.cos(t*0.33457)*0.44))*0.5
  samples[2] = (1 + math.sin(t*0.68363 + math.cos(t*1.3)*1.55))*0.5
  samples[3] = (1 + math.sin(t*1.1642 + math.cos(t*0.33457)*1.24))*0.5
  samples[4] = (1 + math.sin(t*0.56345 + math.cos(t*1.63)*0.14))*0.5
  samples[5] = (1 + math.sin(t*1.6245 + math.cos(t*0.254)*0.3))*0.5
  samples[6] = (1 + math.sin(t*0.345 + math.cos(t*0.03)*0.6))*0.5
  samples[7] = (1 + math.sin(t*0.953 + math.cos(t*1.03)*0.8))*0.5
  samples[8] = (1 + math.sin(t*1.333 + math.cos(t*1.23)*0.38))*0.5

  local sx = {}
  local sy = {}
  local dx = w / 7.0
  for i=1, 8 do
    sx[i] = x + (i-1)*dx;
    sy[i] = y + h*samples[i] * 0.8
  end


  -- Graph background
  gh_nvg.begin_path()
  gh_nvg.move_to(sx[1], sy[1])
  for i=2, 8 do
    gh_nvg.bezier_to(sx[i - 1] + dx*0.5, sy[i - 1], sx[i] - dx*0.5, sy[i], sx[i], sy[i])
  end
  gh_nvg.line_to(x + w, y + h)
  gh_nvg.line_to(x, y + h)
  --gh_nvg.fill_paint_linear_gradient(x, y, x, y+h,    0.0, 160/255, 192/255, 0.0,    0.0, 160/255, 192/255, 64.0/255.0)
  gh_nvg.fill_paint_linear_gradient(x, y, x, y+h,    r0,g0,b0,0.0,    r0,g0,b0,64.0/255.0)
  --gh_nvg.fill_color(0.0, 0.5, 1.0, 0.5);


  -- Graph line
  --[[
  gh_nvg.begin_path()
  gh_nvg.move_to(sx[1], sy[1] + 2)
  for i=2, 8 do
    gh_nvg.bezier_to(sx[i - 1] + dx*0.5, sy[i - 1] + 2, sx[i] - dx*0.5, sy[i] + 2, sx[i], sy[i] + 2)
  end
  gh_nvg.stroke(0.0, 0.0, 0.0, 32/255, 3.0);
  --]]


  gh_nvg.begin_path()
  gh_nvg.move_to(sx[1], sy[1])
  for i=2, 8 do
    gh_nvg.bezier_to(sx[i - 1] + dx*0.5, sy[i - 1], sx[i] - dx*0.5, sy[i], sx[i], sy[i])
  end
  --gh_nvg.stroke(0.0, 160.0/255.0, 192.0/255.0, 1.0, 3.0);
  gh_nvg.stroke(r1,g1,b1,1.0,  3.0);


  -- Graph sample pos
  for i=1, 8 do
    gh_nvg.begin_path()
    gh_nvg.rect(sx[i] - 10, sy[i] - 10 + 2, 20, 20)
    gh_nvg.fill_paint_radial_gradient(sx[i], sy[i] + 2, 3.0, 8.0,    0,0,0,32/255,    0,0,0,0)
    --gh_nvg.fill_color(0.0, 0.5, 1.0, 0.5);
  end


  gh_nvg.begin_path()
  for i=1, 8 do
    gh_nvg.circle(4.0, sx[i], sy[i])
  end
  --gh_nvg.fill_color(0.0, 160.0/255.0, 192.0/255.0, 1.0);
  gh_nvg.fill_color(r0,g0,b0,1.0);

  gh_nvg.begin_path()
  for i=1, 8 do
    gh_nvg.circle(2.0, sx[i], sy[i])
  end
  gh_nvg.fill_color(220.0/255.0, 225.0/255.0, 220.0/255.0, 1.0);

end


drawGraph(20, winH-20-200, winW*0.4, 200, elapsed_time,      220.0/255.0, 160/255, 12/255,    1,0.4,0.1)
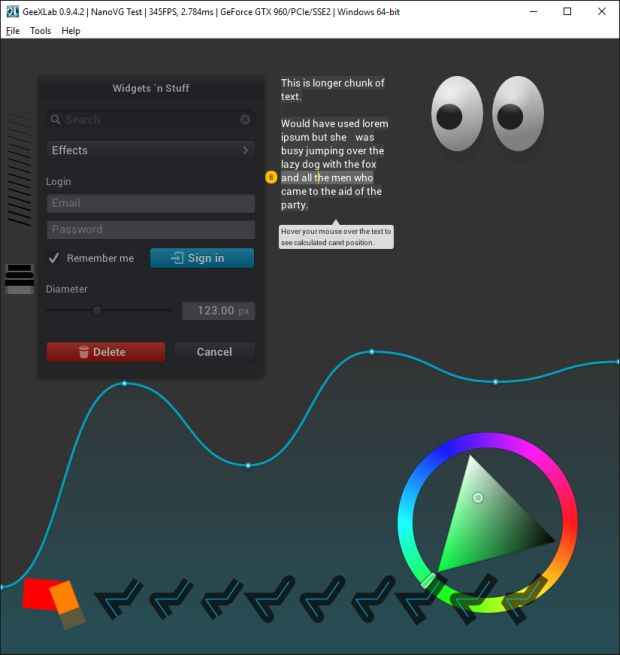
I also added in a single function the orignal NanoVG demo:
local elapsed_time = gh_utils.get_elapsed_time()
local mx, my = gh_input.mouse_getpos()
gh_nvg.demo_draw(winW, winH, mx, my, elapsed_time)